¶ AnexConnect
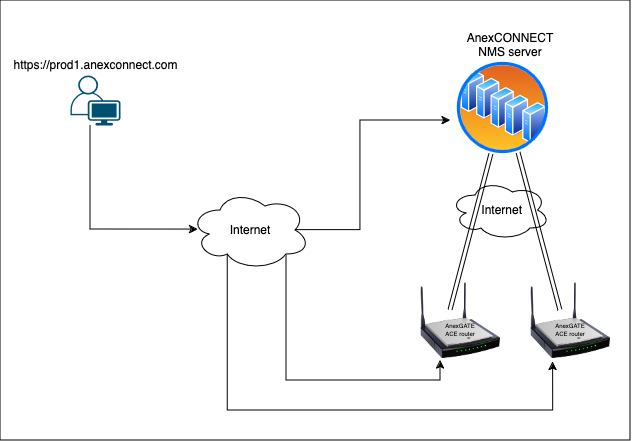
AnexCONNECT is a service which lets the user monitor and control the state of the AnexGATE appliances as well as change the some basic configuration in the AnexGATE Ace Router.
NOTE:
Changing Network will cause the appliance to be unreachable. configuration settings of AnexGATE appliance can be changed except Network settings as the connection of appliance towards Anexconnect
¶ Login to AnexCONNECT
AnexGATE TEM will create a Super User account, and we will provide the details to the customer. The customer can then create their respective users.
If the customer has their own server, they will have permission to create their own users.
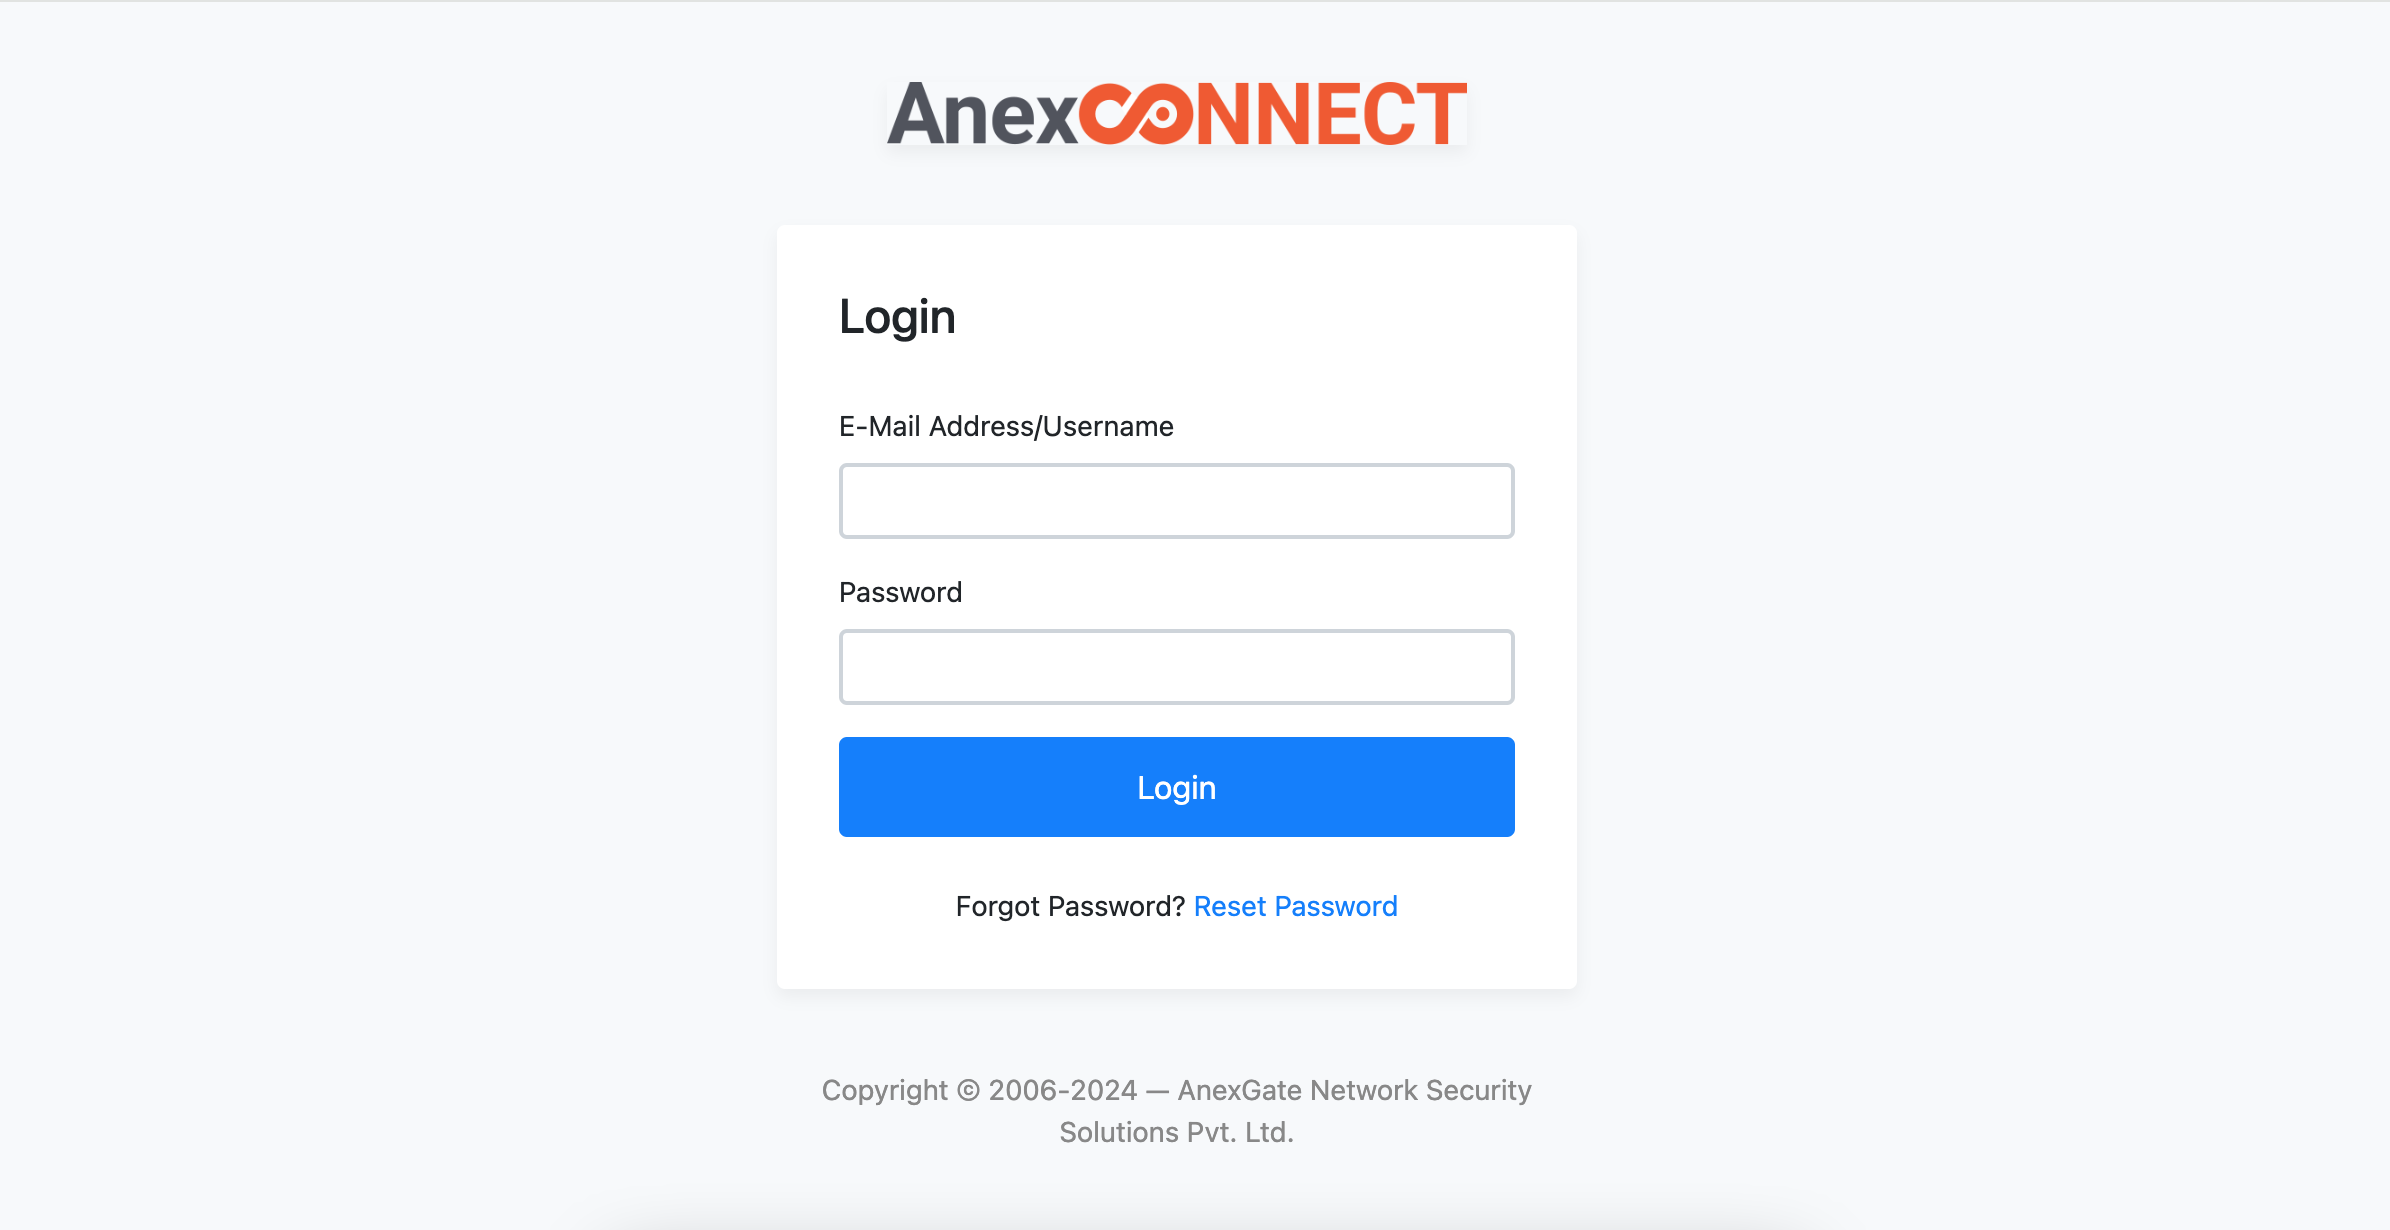
Sign up and Create an account at AnexCONNECT https://prod1.anexconnet.com
¶ Adding devices to AnexCONNECT
Once the Account has been verified. Login to AnexCONNECT with the user credentials.
Go to AnexConnect - Add Devices, Enter License key details of the AnexGATE router.
for adding multipal device onse either you can seperated with new line or comma ,
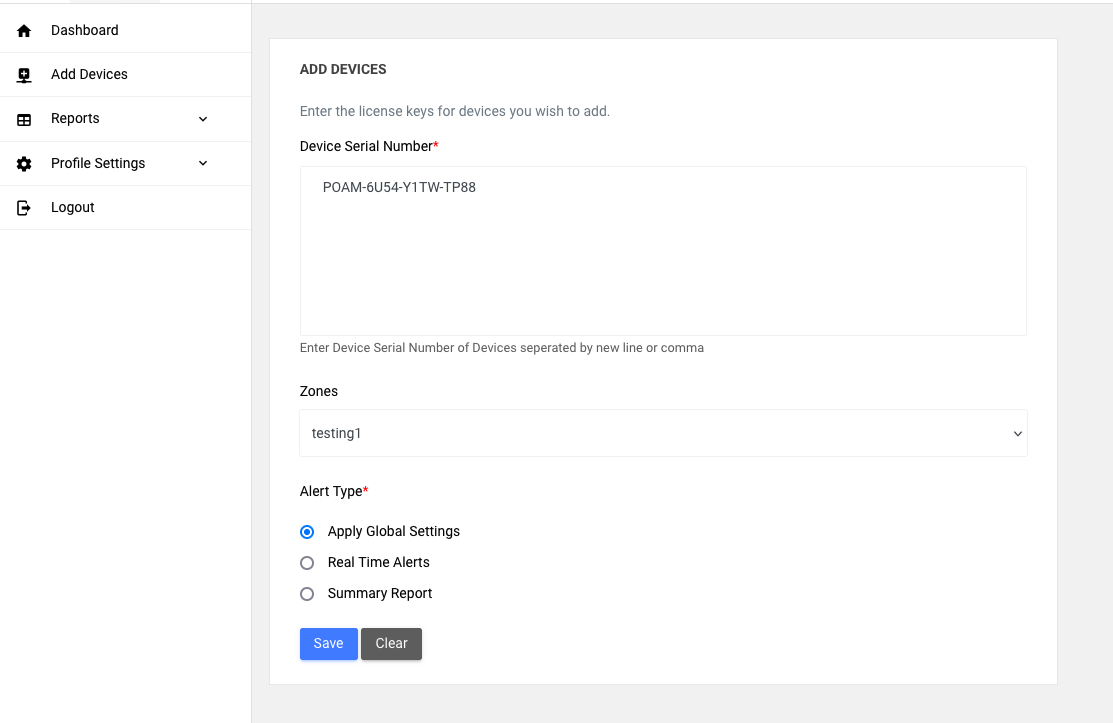
Also you can decide alart type
Global alart: when you select this then what default alart you selected for all user that will apply for adding device
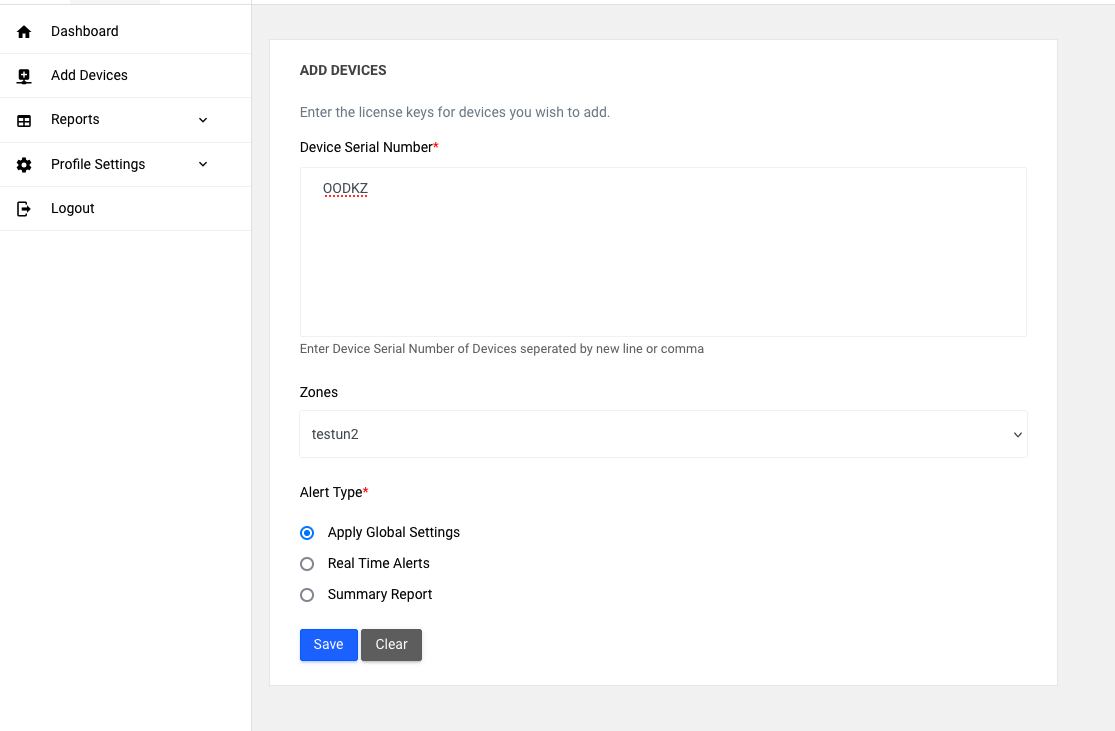
Rel time alart: Real-time alerts send a notification to the specified email address whenever an alert is generated. These alerts include events such as interface up/down status and device reboots.
Summary Report A summary report will be generated for all alerts of a specific device and sent at the specified time to the mentioned email addresses. You can provide multiple email addresses separated by commas.
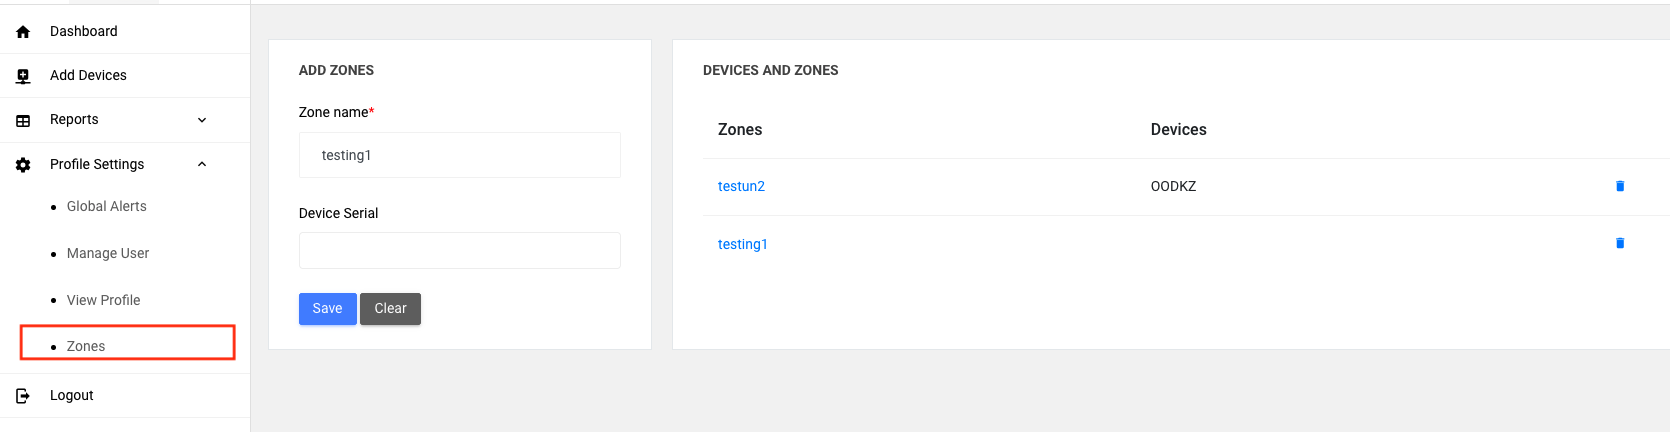
zones
The Zone Field is optional when adding a device to the NMS server.
Key Details:
-
Zones will only appear if you have created them in the Profile Settings > Zone Tab
-
If you select a specific zone, the device will be bound to that zone and all zones.
-
If no zone is selected, the device will be assigned to all zones by default.
This flexibility allows you to organize devices based on zones or keep them accessible across all zones.
For some Super Admins with their own NMS server, they will be required to provide the serial number of the device while adding it.
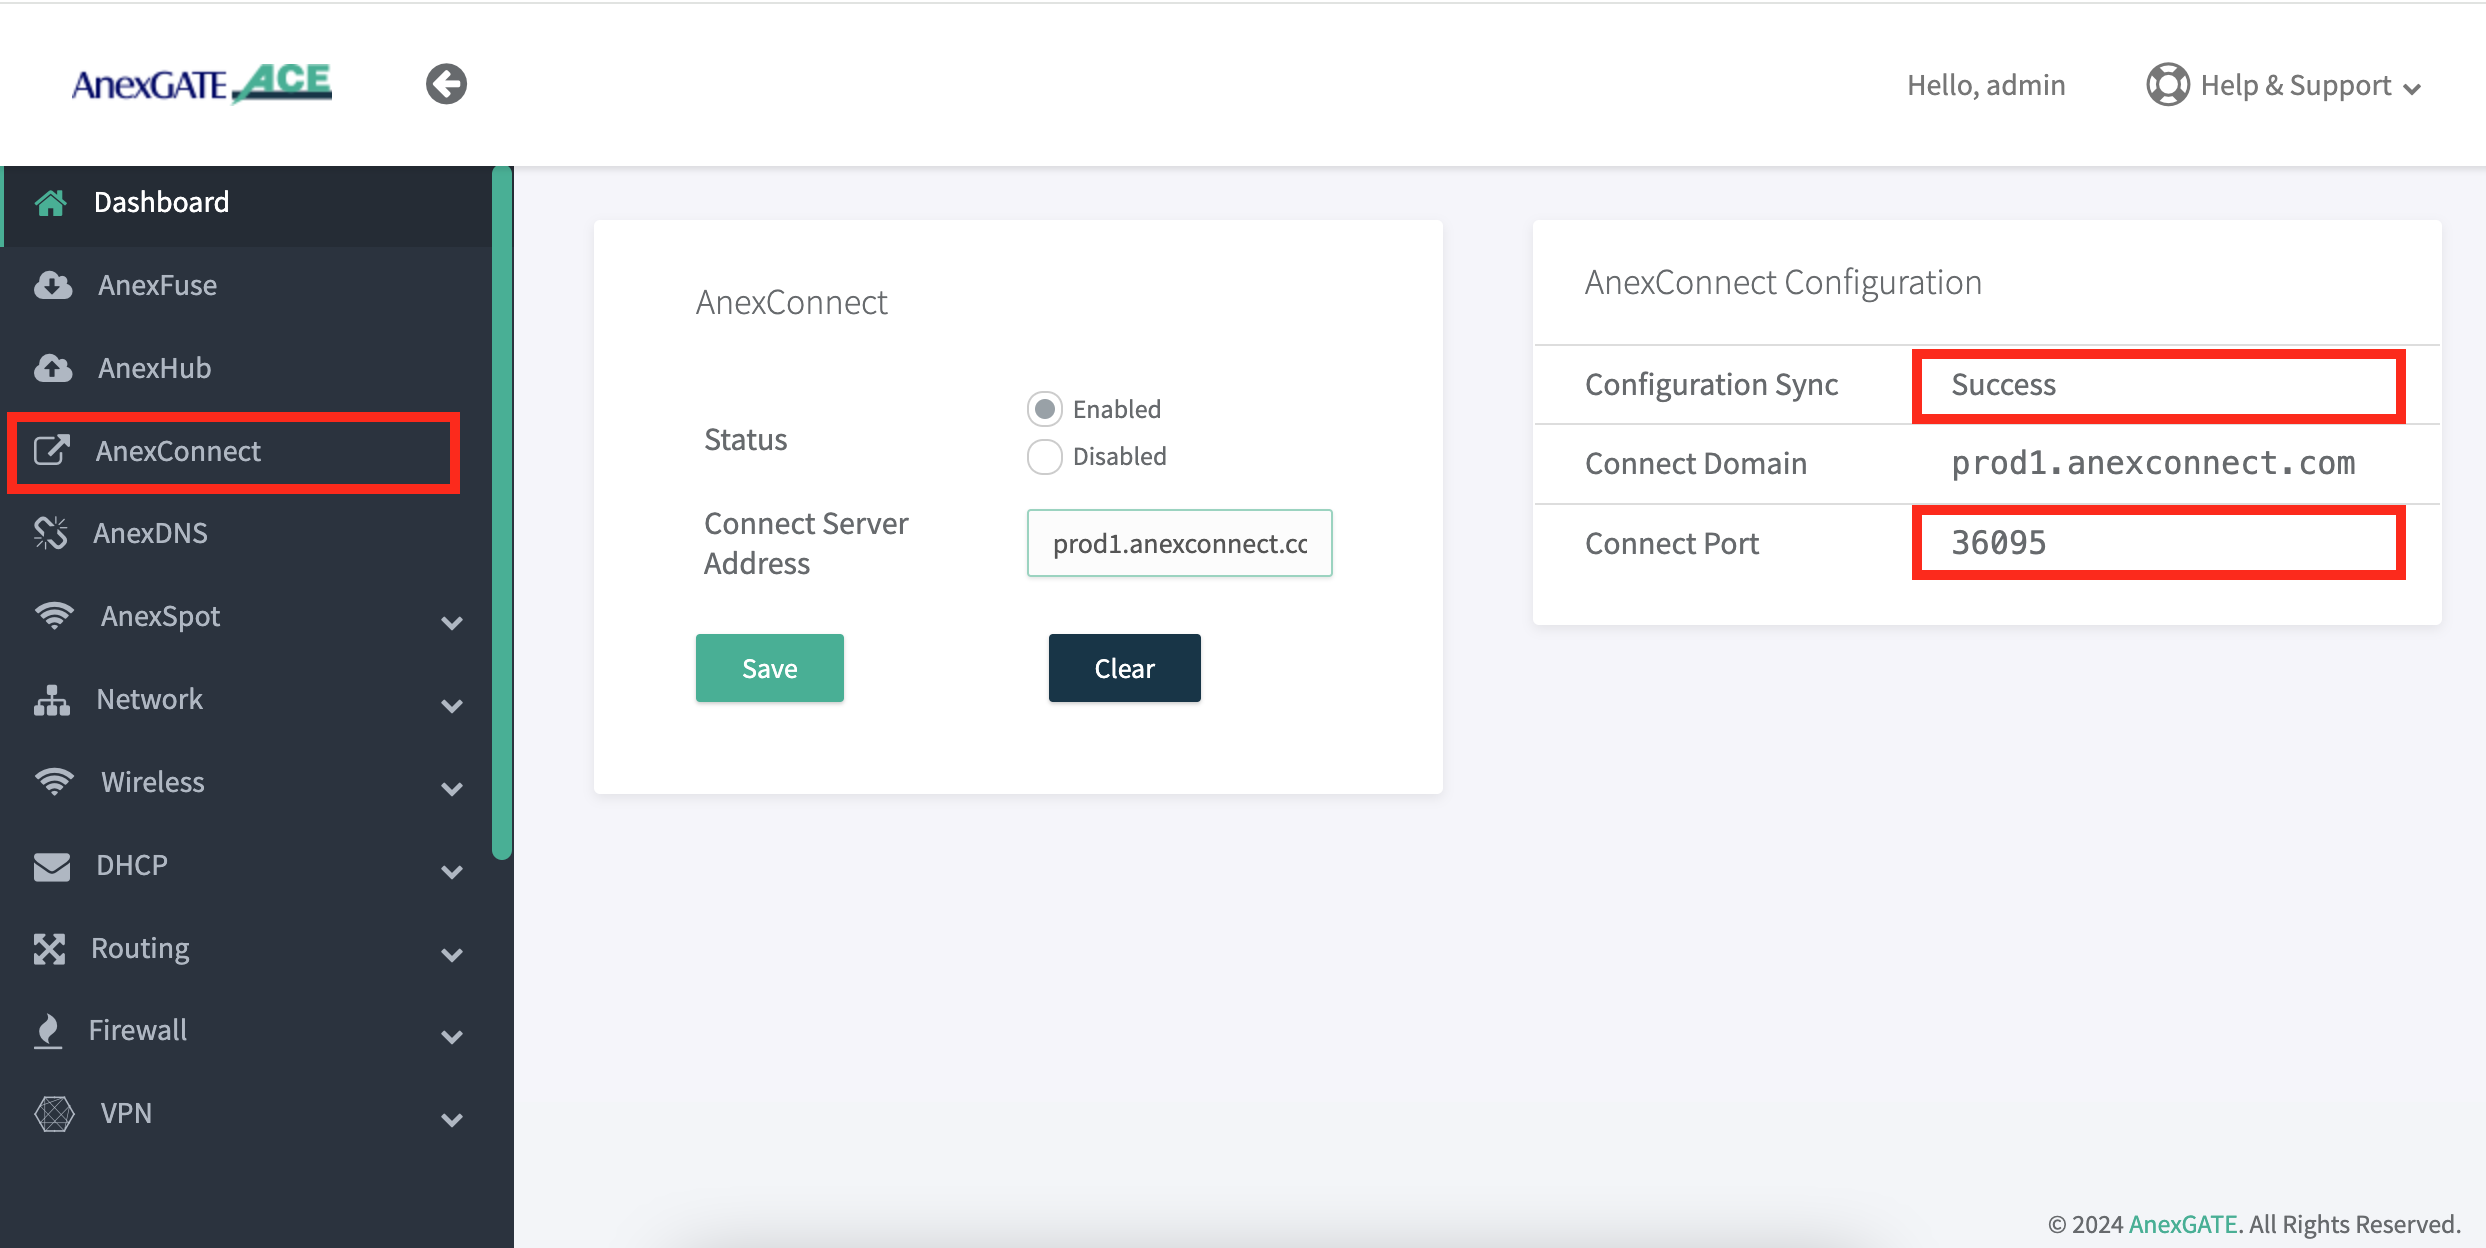
¶ Enable anexconnect in ACE router
- Log in to the AnexGATE router and navigate to the AnexConnect tab.
- Enable AnexConnect by entering a proper domain name.(ex prod1.anexconnect.com )
- Once the domain name is added, it will sync with your NMS server and establish a connection between the router and the NMS server.
- After the connection is successfully established, a success message will appear on the ACE connect dashboard, as shown below image , along with a unique port number.
- Confirm that the device and NMS server connection is proper.
- If the connection is not established, disable the configuration and enable it again.
NOTE :
1. Before enabling AnexConnect, ensure that the device is first added to the AnexConnect NMS server.
2. Only after the device is added to the NMS server can you enable the AnexConnect configuration in ACE.
3. If the device is not added to the NMS server, enabling AnexConnect in ACE will result in an error message.
NOTE
When restoring a backup file from one device to another:
1. After uploading the backup file to the new device, disable AnexConnect and then enable it again.
2. This step is necessary because the backup file includes the connect port, which must be unique for each router.
3. Disabling and re-enabling AnexConnect ensures the system fetches a new, unique connect port and establishes a proper connection.
¶ AnexCONNECT Dashboard
Ones connection is stablish from ACE router then Go to AnexCONNECT NMS Dashboard to view the status of the device. The AnexGATE Ace Routers connectivity over AnexCONNECT portal is denoted as following:
GREEN– Device is online.
RED– Device is offline
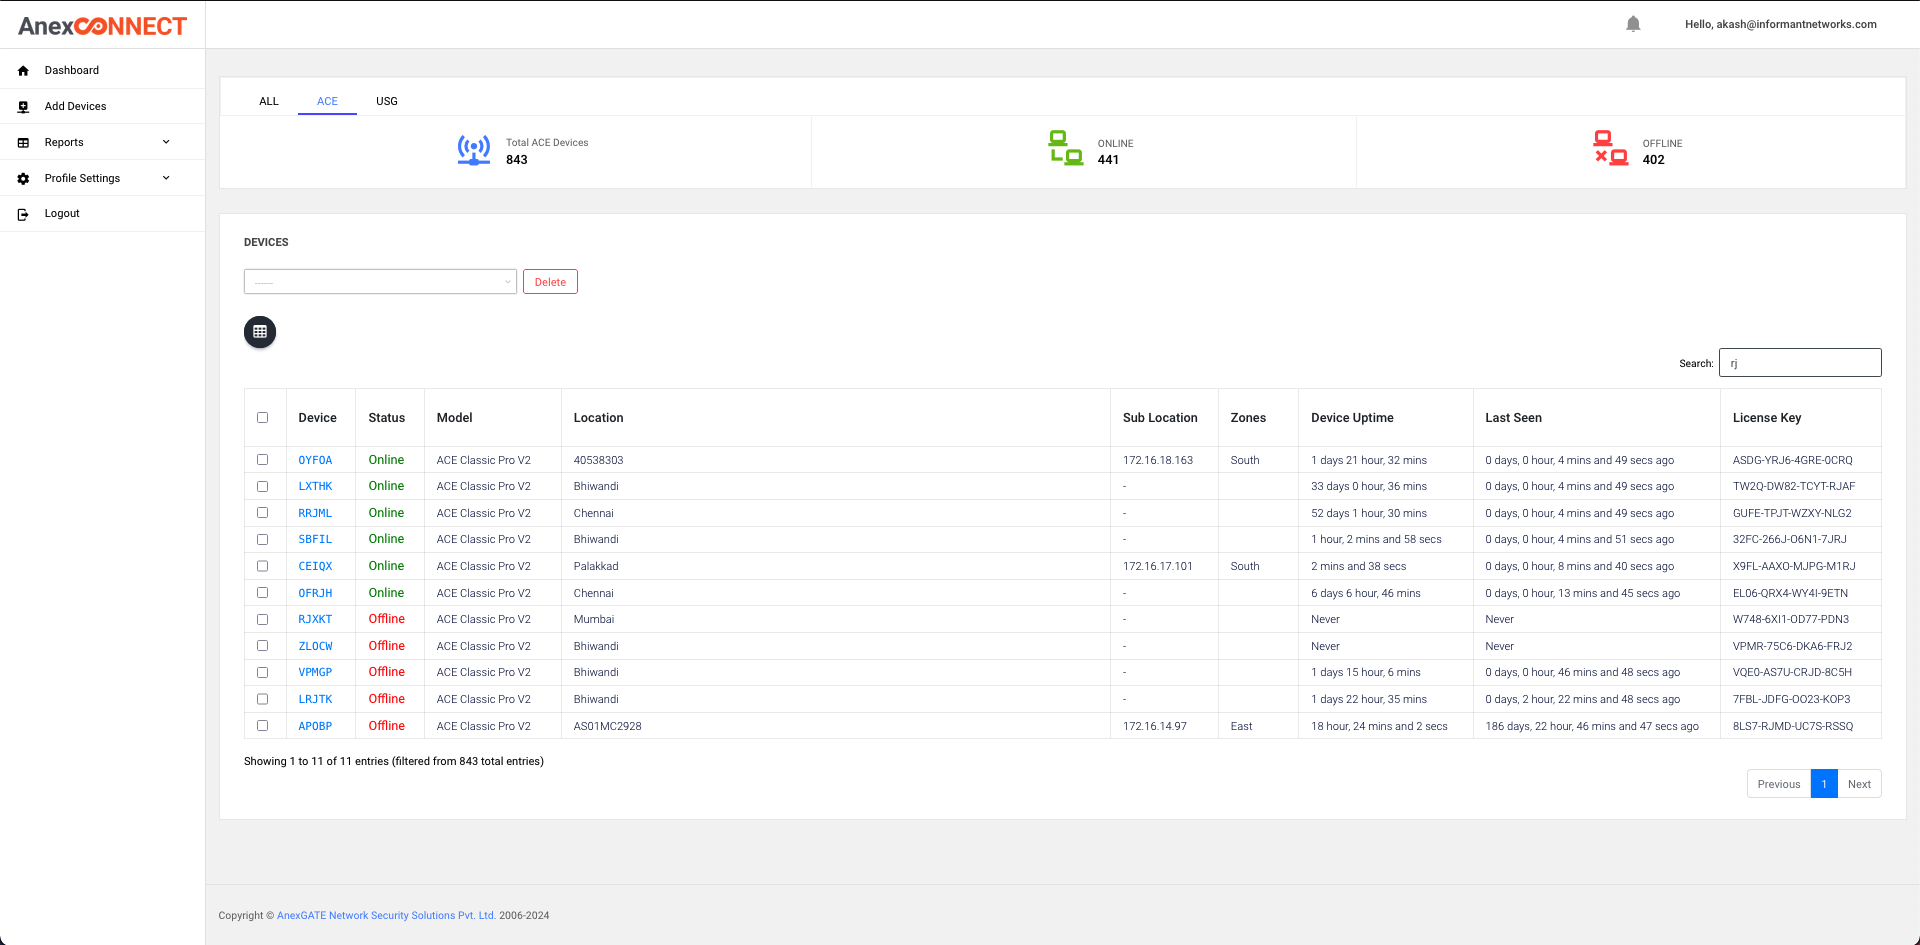
The dashboard shows the model of the ACE device, location, sublocation, as well as last seen time of device , also shows how many device are online and offline of existing customer in presence
Device Information of the AnexGATE Router can be viewed by clicking on device NAME highlighted in blue.
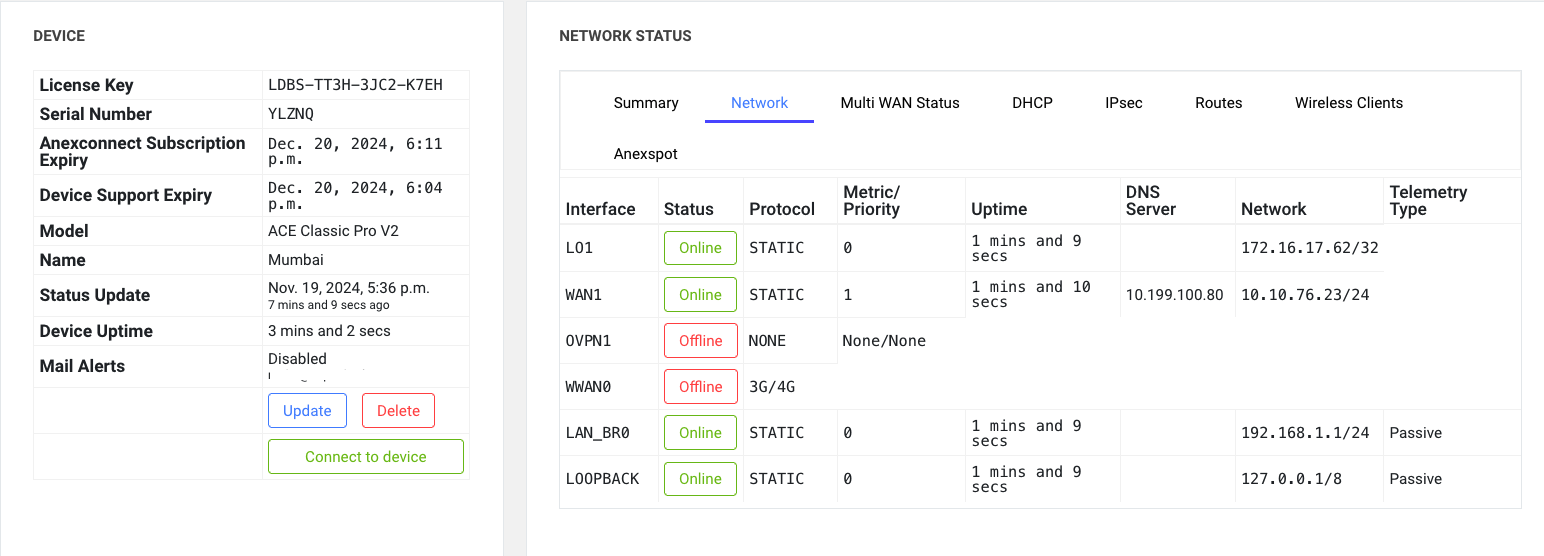
¶ Single Device Information
¶ Device Tab Overview:
The Device Tab displays detailed information about all devices, including:
- License Key
- Support Expiry
- Model Name
- Device Uptime
- Last Sync Time with the NMS server
- Connect to Device button, which directly redirects you to the ACE interface of the selected device.
- update buttan allows you to update location, sublocation, zone, email address form specifice device alart
- delete button can delete device from anexconect portal
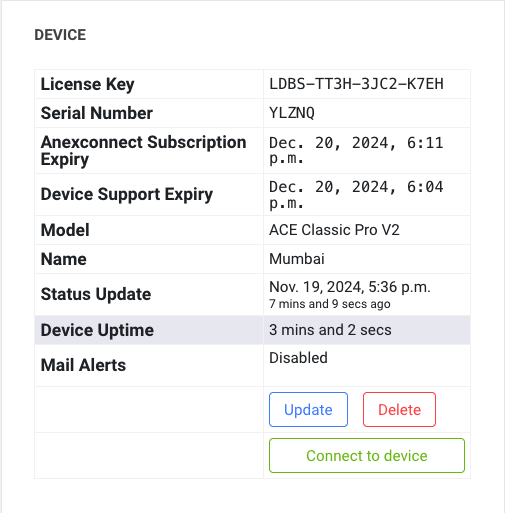
¶ Connect to Device button
The Connect to Device button redirects you directly to the ACE interface of the selected device. Through this interface, you can:
- Modify configurations (Avoid making internet network configuration changes).
- Perform troubleshooting directly on the device.
Network Changes:
Proper Network Configurations
- If you make network configuration changes, the connection with the NMS server may temporarily be lost.
- If the changes are correct, the connection will automatically re-establish after some time, and you will regain access to the device.
Incorrect Network Configurations:
- If the network configuration changes are incorrect, the device may lose internet connectivity.
- In such cases, the connection with the NMS server will not re-establish automatically.
- You will need to log in to the device locally to check and correct the configurations.
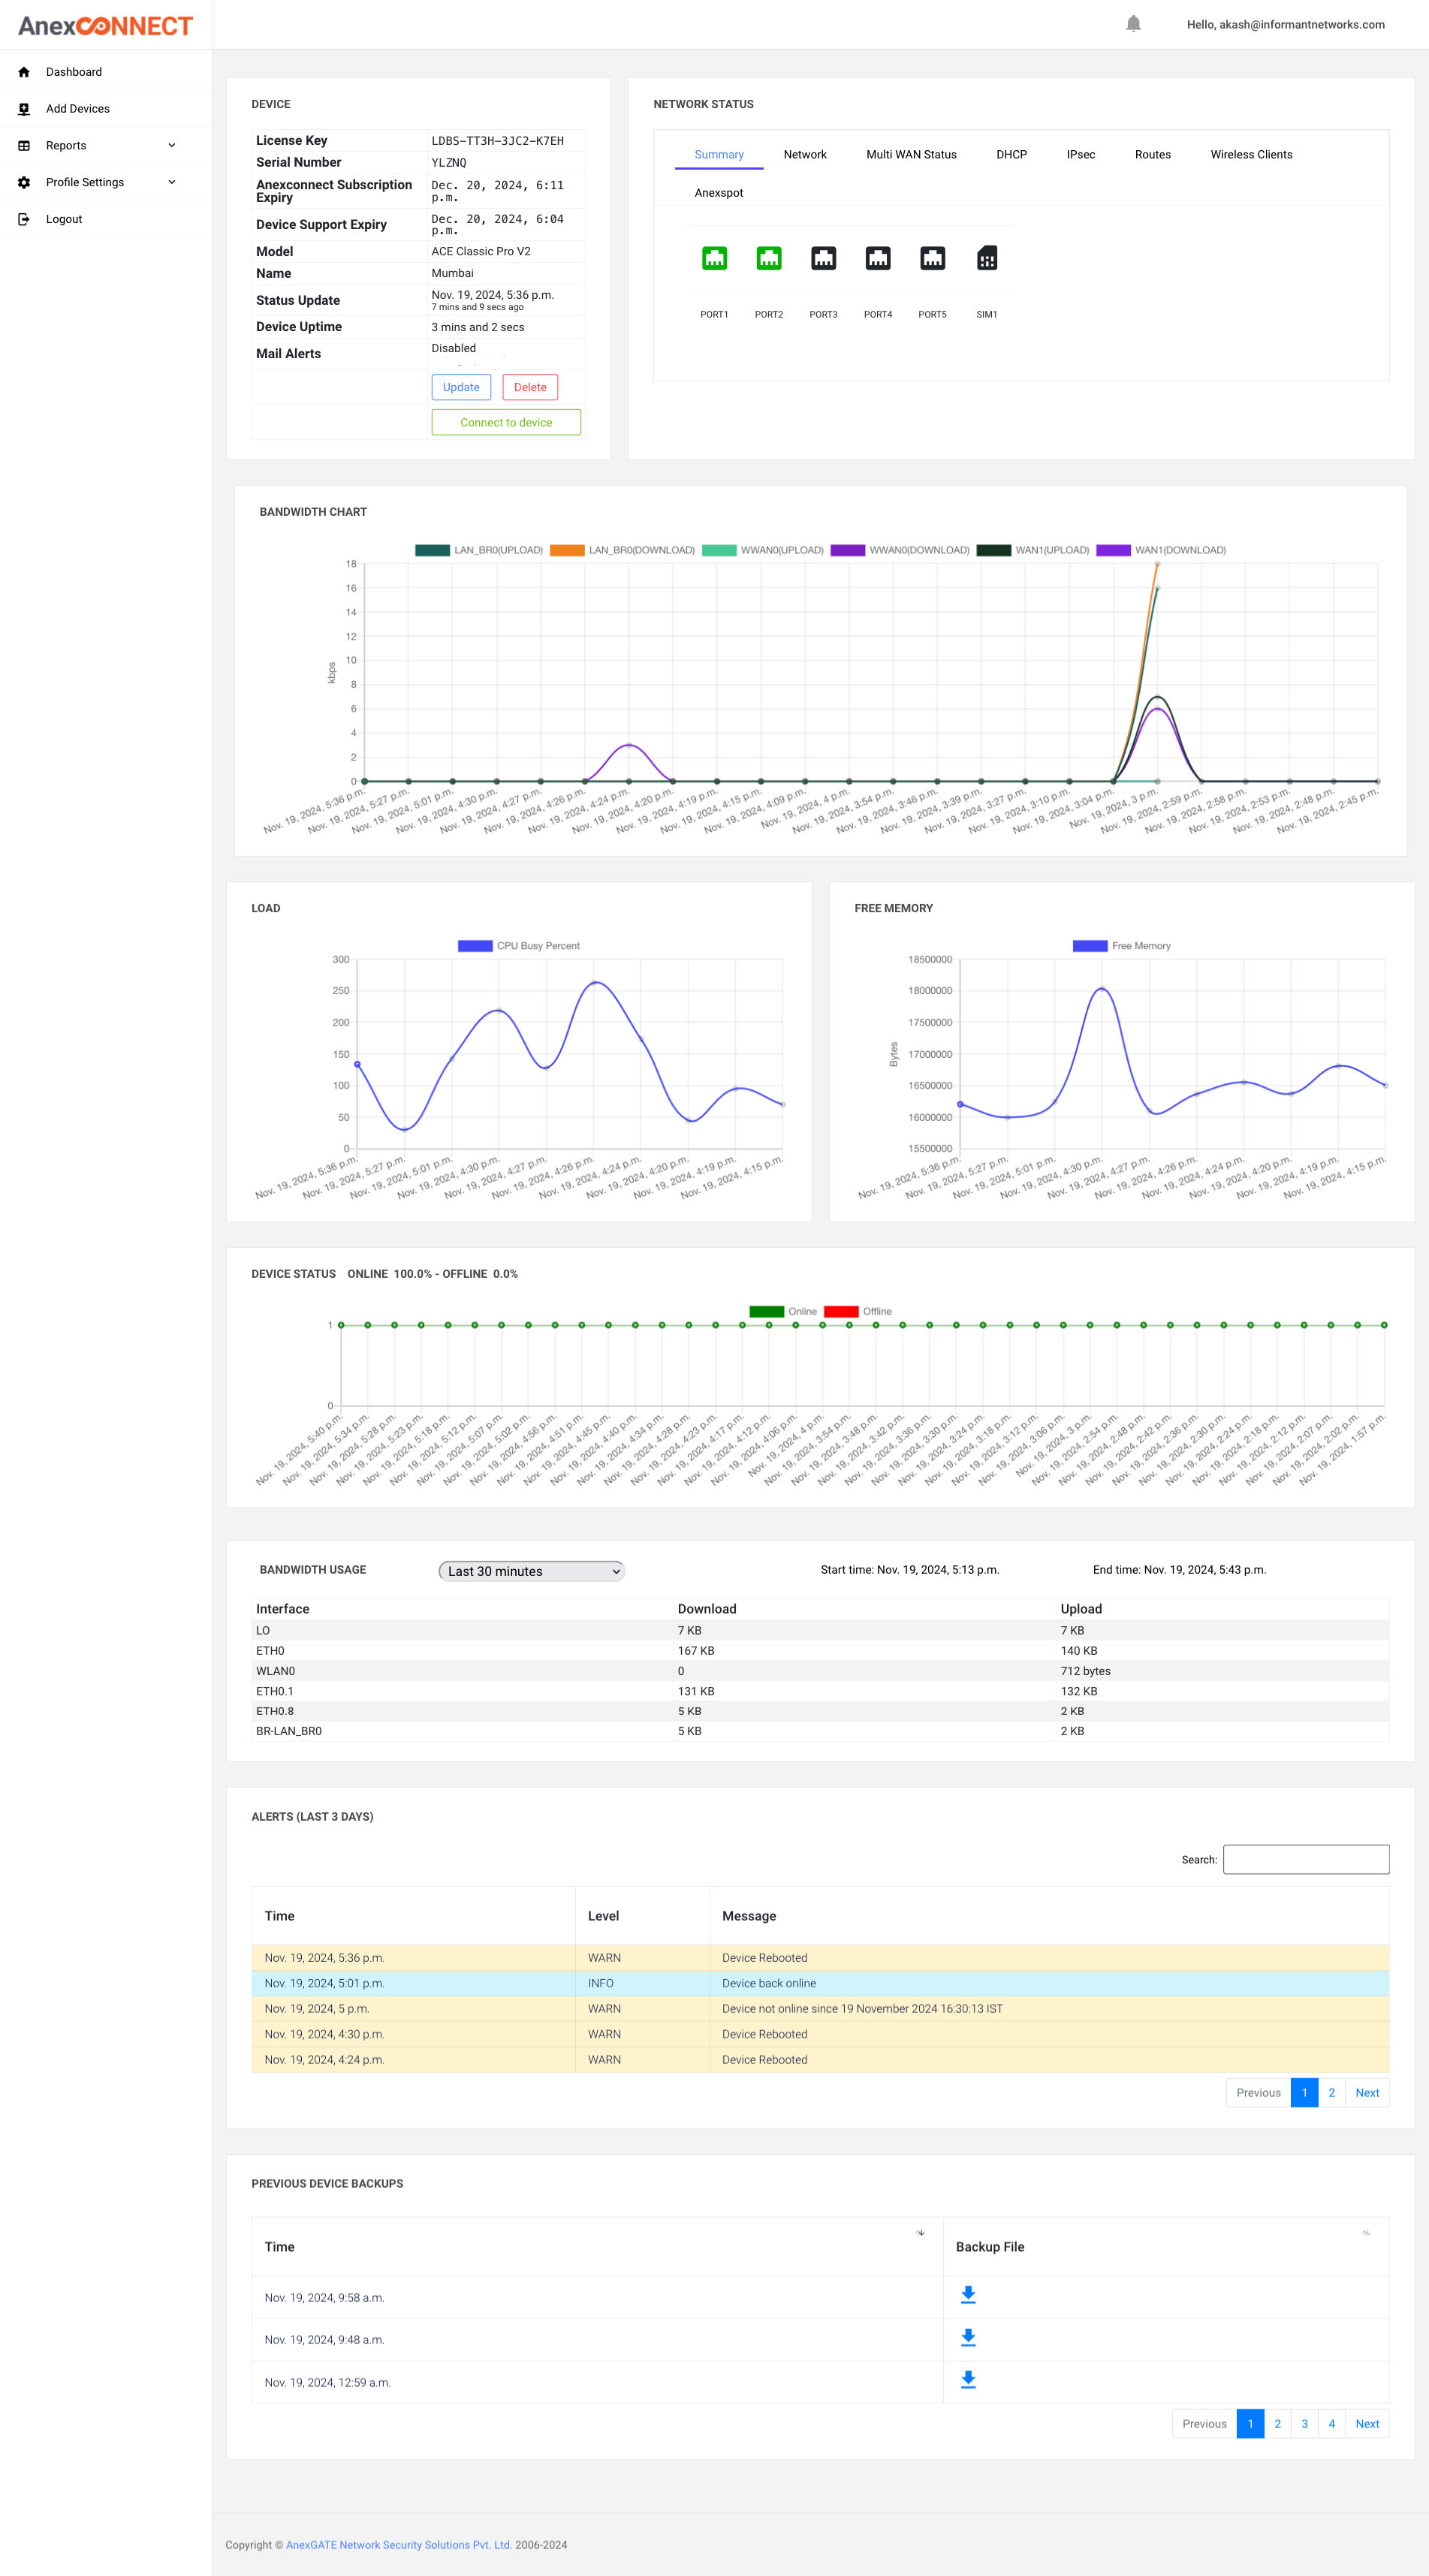
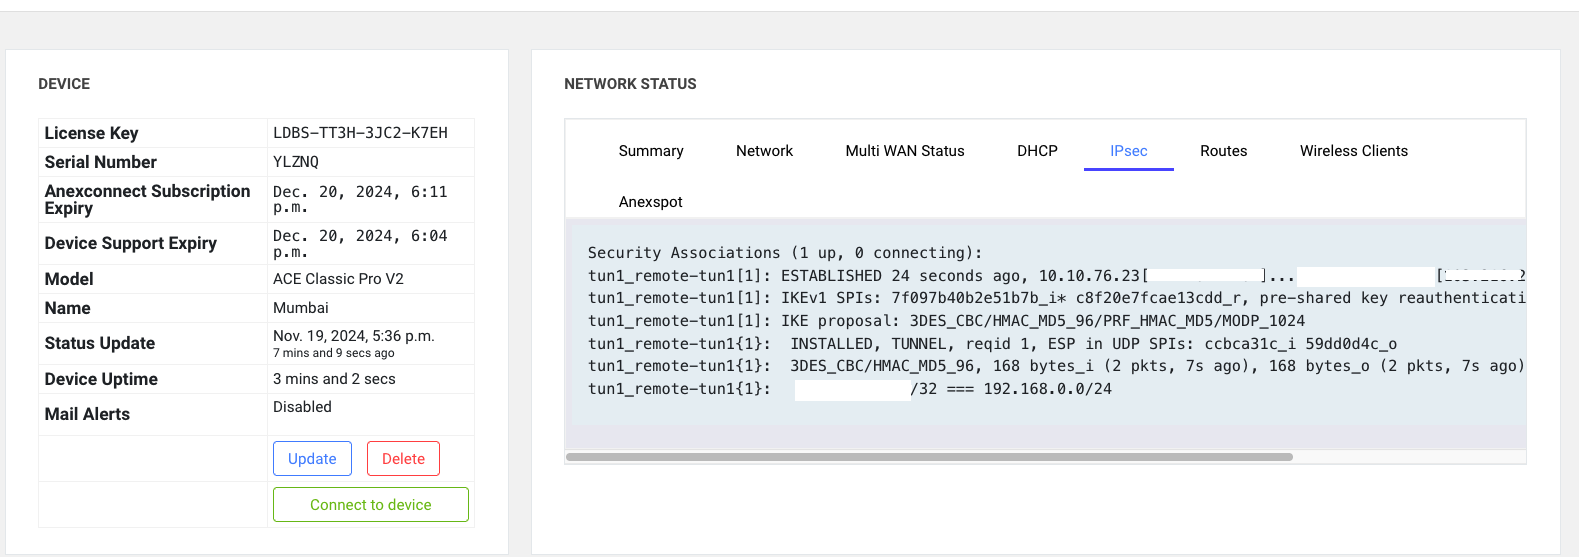
¶ Network status Tab Overview:
The Network Status tab provides the following details:
-
Summary:
- Displays the status of all physical ports (connected or not).
- Indicates whether a SIM or USB is present in the router.
-
Network:
- Shows the status of all configured interfaces along with their IP details.
- Displays proper interface uptime.
- Includes VPN interface details.
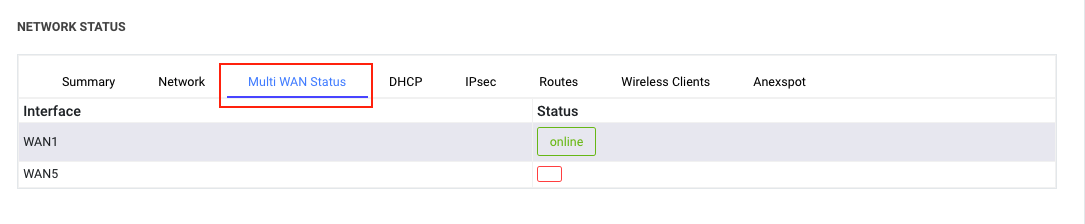
-
Multi-WAN Status:
- Displays the status of all Multi-WAN configurations (online or offline).
- Visible only when Multi-WAN is configured in the AnexGATE ACE router.
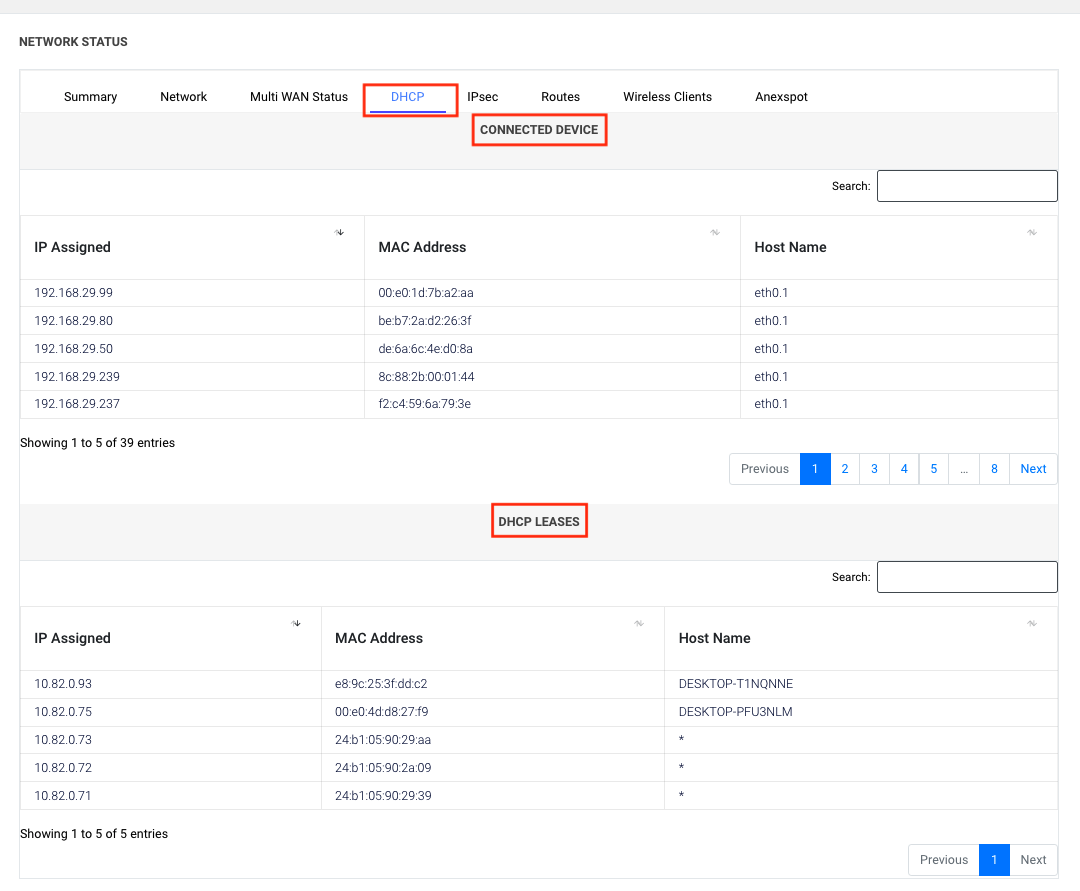
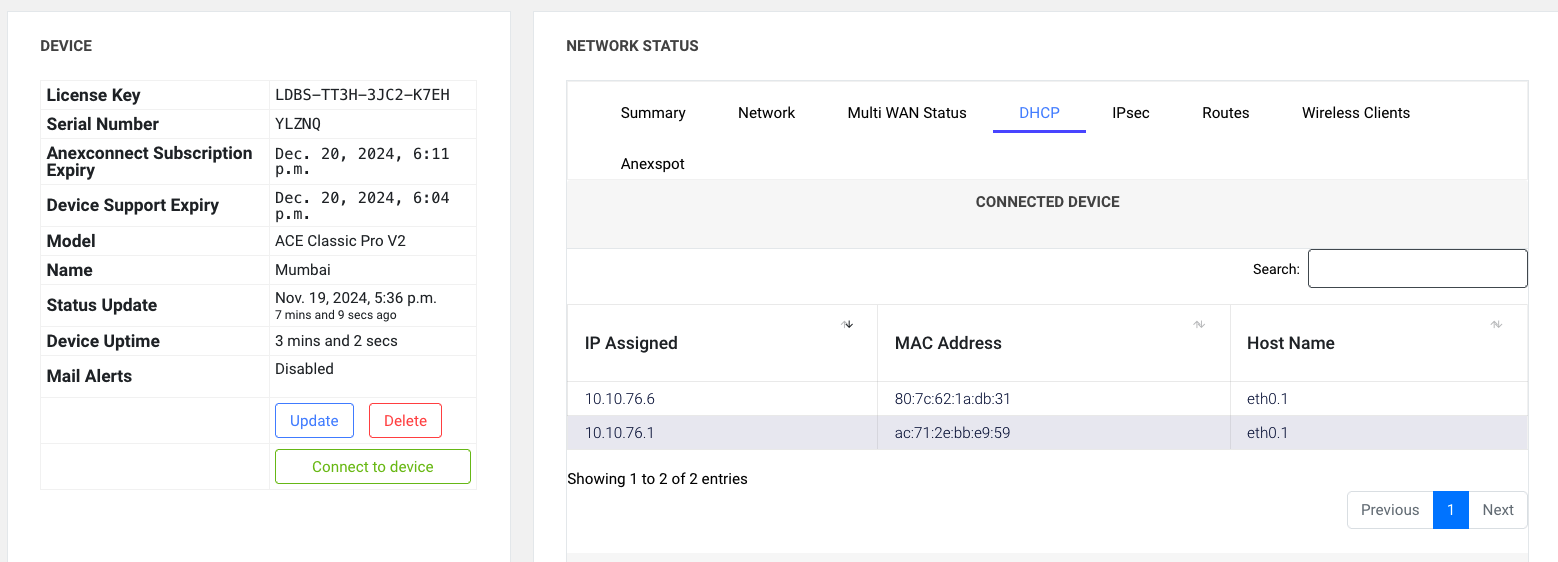
-
DHCP:
- Lists all DHCP-connected clients, including hostnames.
- Displays all connected devices in the ACE router, including static devices.
-
IPSEC:
- Shows the last connection status of the IPSEC tunnel.
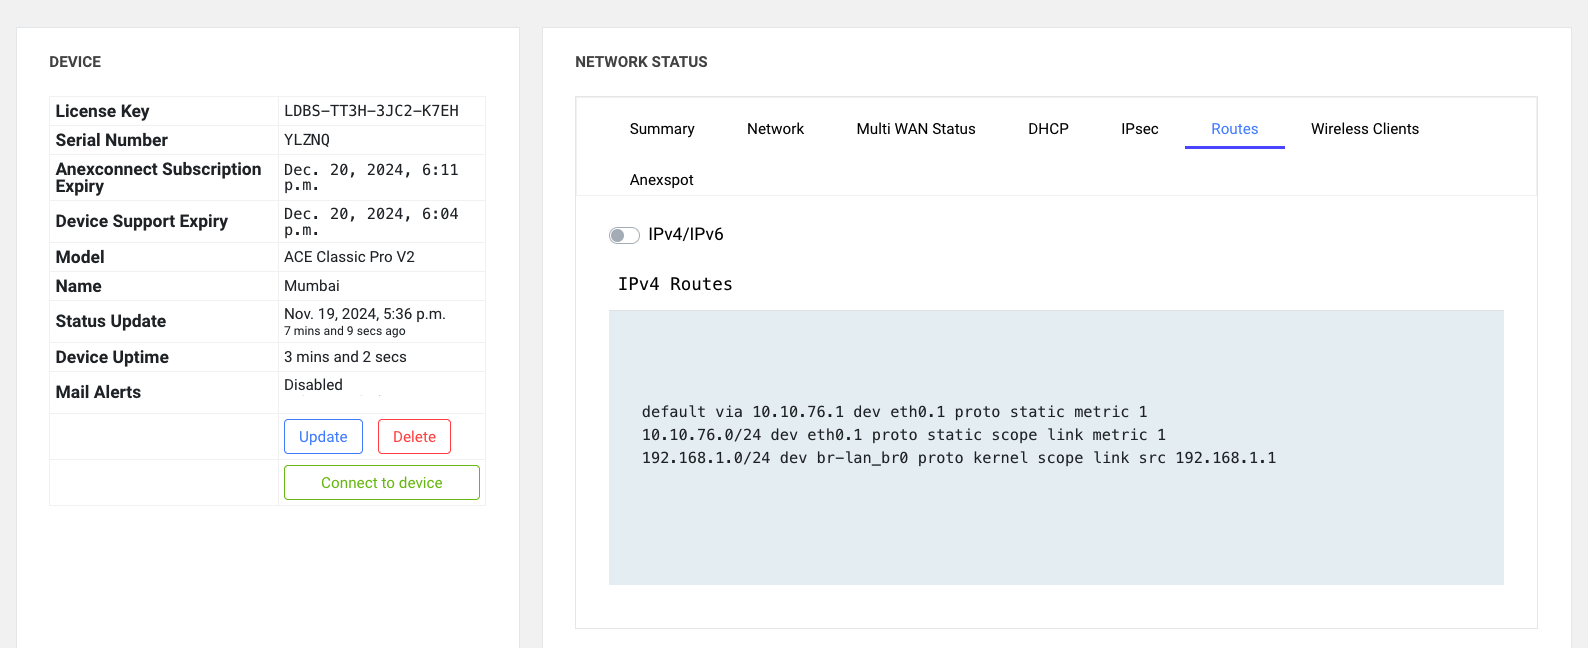
6. Route:
- Displays the default routing table of the ACE router.
7. Wireless Client:
- Provides details of wireless-connected devices.
8. AnexSpot:
- If the ACE router is enabled with an AAA server and AnexSpot, it shows the status of devices connected through AnexSpot.
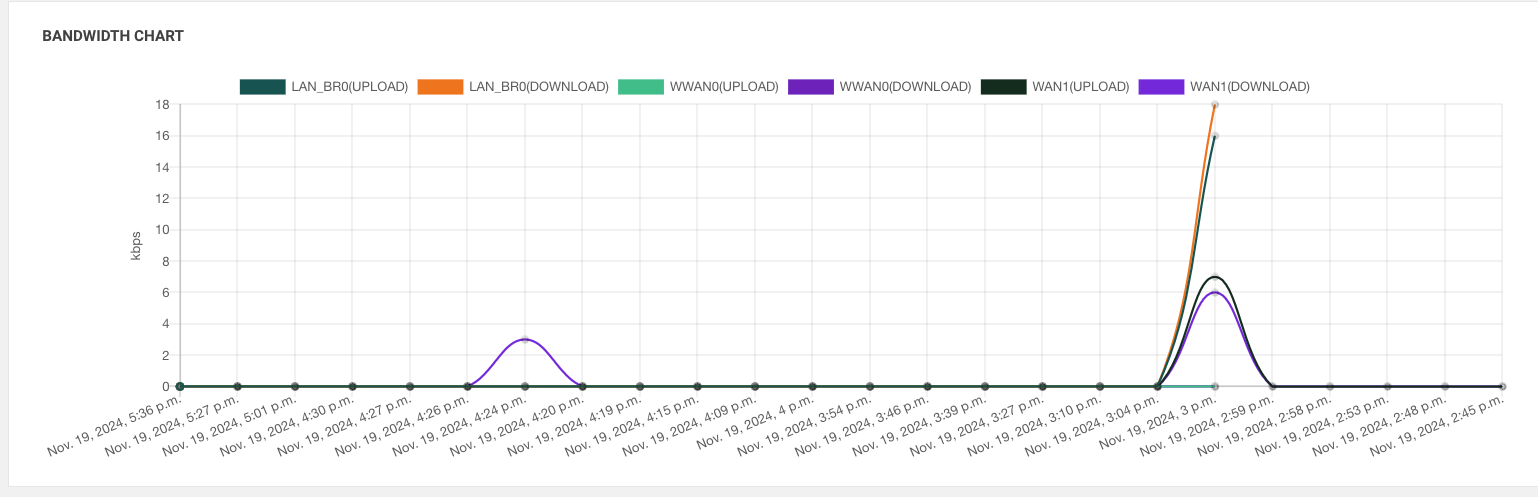
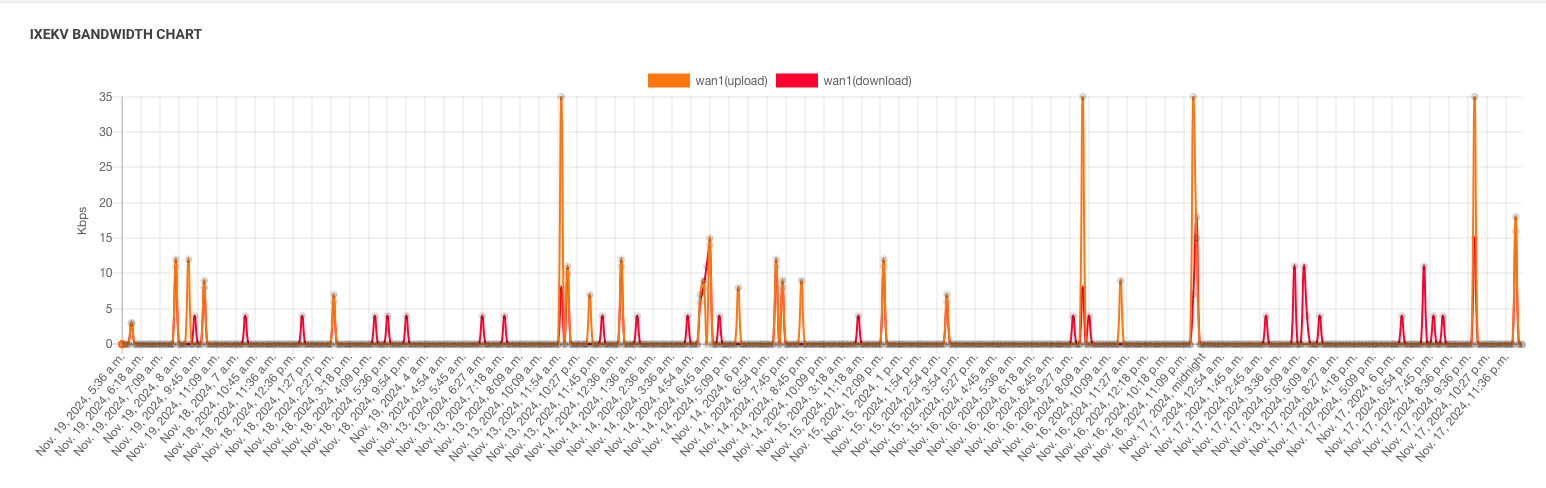
¶ Bandwidth Chart
The Bandwidth Chart plots a graph showing the data traffic speed based on the following events:
Browsing / Downloading Data:
When browsing and downloading data through the router, the speed observed on the interface is captured and displayed in the bandwidth chart.
ACE Router to NMS Data Transmission:
When the ACE router sends data to the NMS server, that time data traffic speed is captured of every interface and shown in the bandwidth chart.
This provides a comprehensive graphical representation of bandwidth speed during different activities.
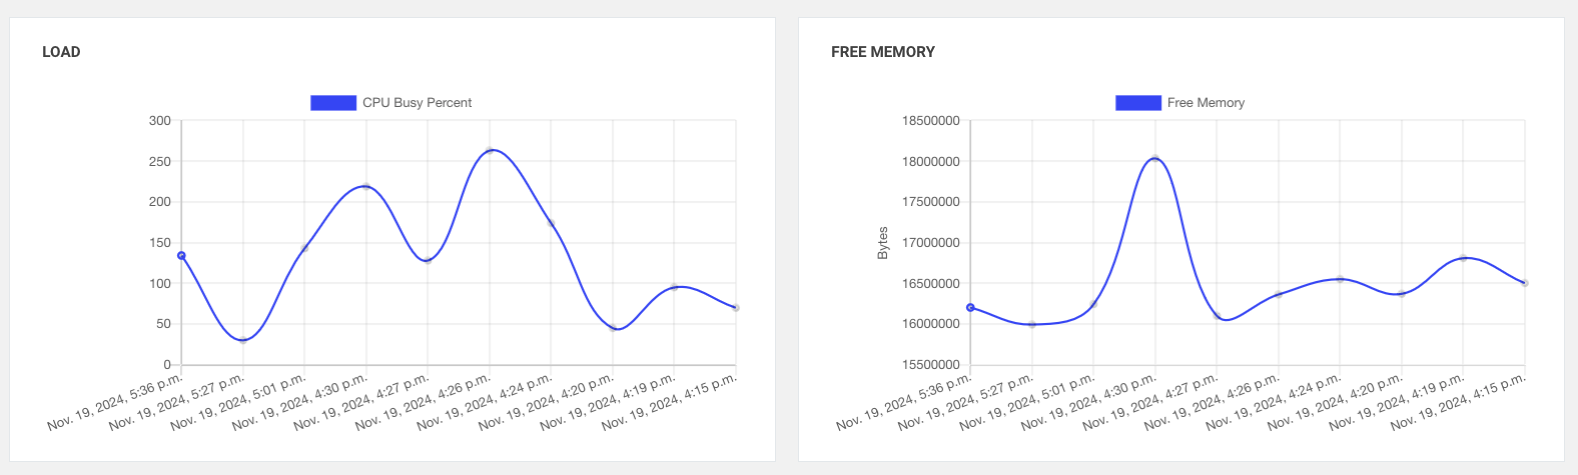
¶ Load and free Memory Tab Overview:
It will show you ACE device load and memory utilised status
¶ Device Status Tab Overview
The system provides the device's online or offline status along with a historical report in graphical form:
Graphical Representation:
- A green line is plotted if the device is online.
- A red line is plotted if the device is offline.
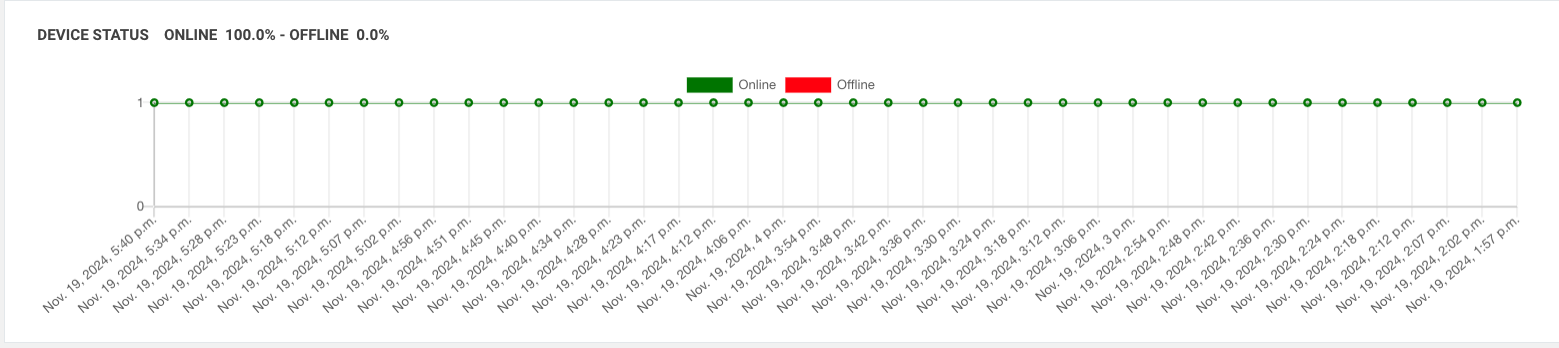
Online/Offline Check (Every 15 Minutes): - The NMS server checks every 15 minutes for either of the following:
1.A ping response from the router.
2.Any information received from the router. - If none of these are received within the 15-minute interval, the device is marked as offline.
- If any of these are received, the device is marked as online.
¶ Bandwidth Usage Tab Overview
The Bandwidth Usage tab provides detailed information about data usage on specific interfaces:
Data Upload and Download: Displays the amount of data uploaded and downloaded on each interface.
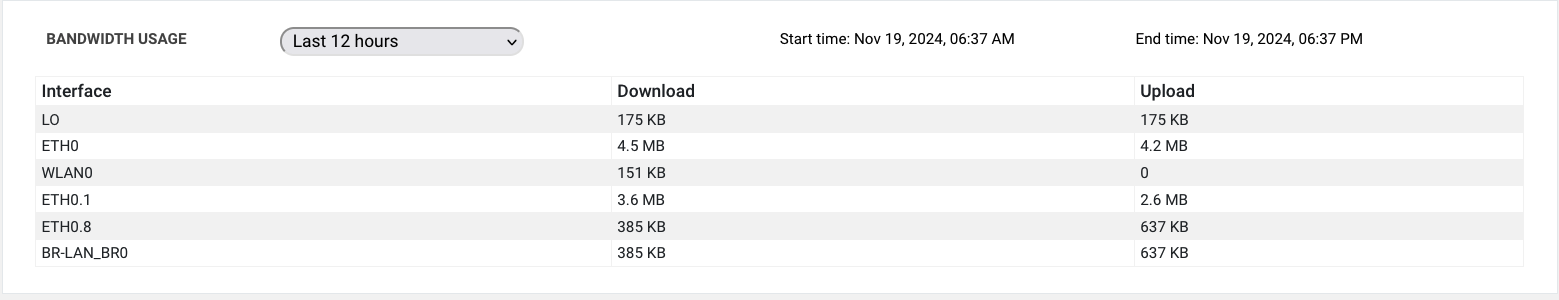
Time-Based Usage Reports:
Shows data usage for the following time periods:
Last 30 minutes
Last 6 hours
Last 12 hours
Today’s total data usage
This allows for monitoring and analyzing bandwidth usage over different timeframes.
¶ Alerts Tab Overview
The Alert Tab provides two types of alerts:
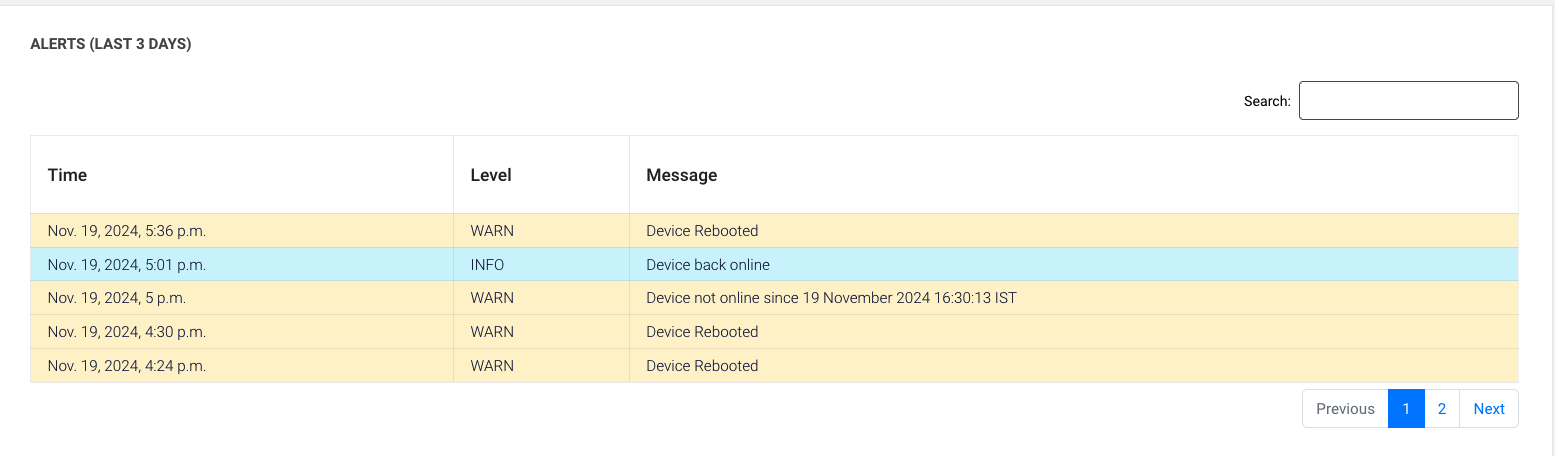
Info Alerts:
These alerts provide real-time notifications for events such as:
- Device online or offline status.
- Device reboots.
- Interface up/down status.
Warn Alerts:
These alerts are triggered for extended issues, such as:
- Device being offline for a certain number of days or hours.
- Interface being down for more than a specified duration'
Warn alerts prompt you to check the device or interface for potential issues.
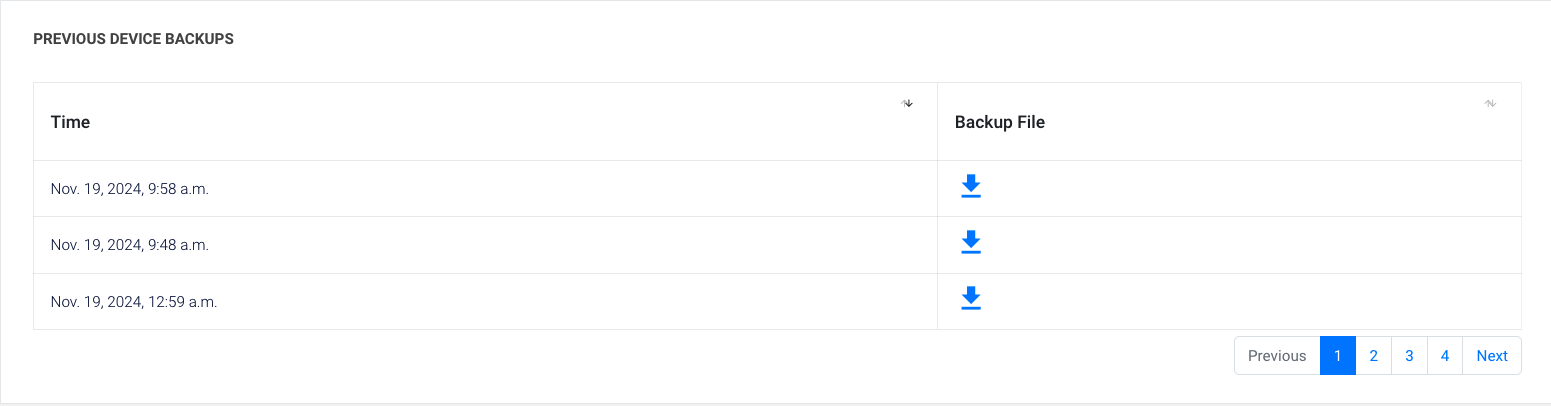
¶ Previous Device Backups Tab Overview
Automatic Backups:
- The ACE router automatically creates a backup whenever it detects any changes in the configuration.
- It maintains the last 10 backups of the device. You can downalod file and addit in ACE router
¶ Reports
¶ Report search tab
When generating a report, there are three tabs for selection
- Device Serial
- Device Name
- Zone
Selection Rules
You must choose only one of these tabs (Device Serial or Device Name, or Zone).
Selecting more than one tab will result in an error.
Multiple Selections
Within a single tab, you can select multiple options:
- Multiple Device Serials
- Multiple Device Names
- Multiple Zones
This allows for generating reports for multiple devices or zones at once.
Hours tab
When you search for a report with the Hours tab set to 1, the report will display the total data report but it will show an entry for every 1-hour interval in the report and graph .
From/To
When you search for a report using a specific time interval (From and To), the report will be generated and displayed based on the selected time range.
when you click on generate report it will generate report and show you
Every report can be downloaded in PDF and Excel formats. However, some reports are available only in Excel format
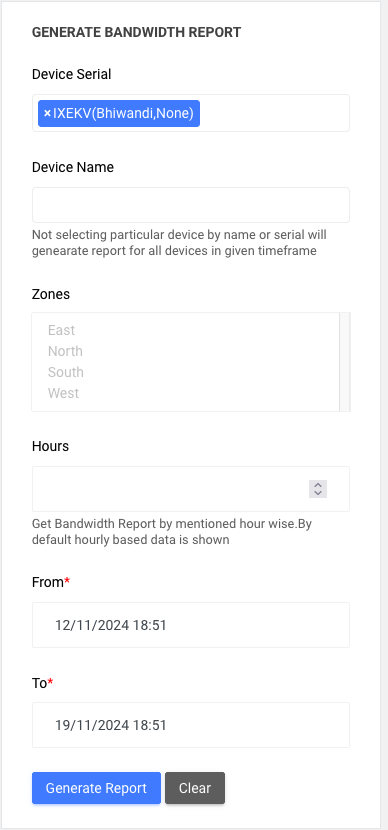
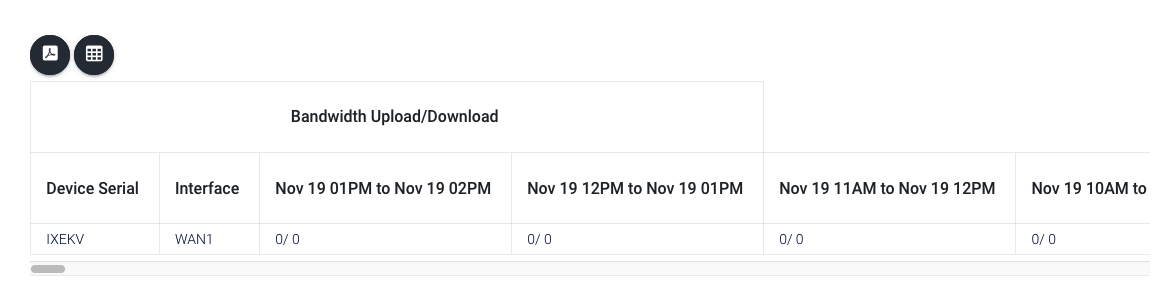
¶ Bandwidth Report
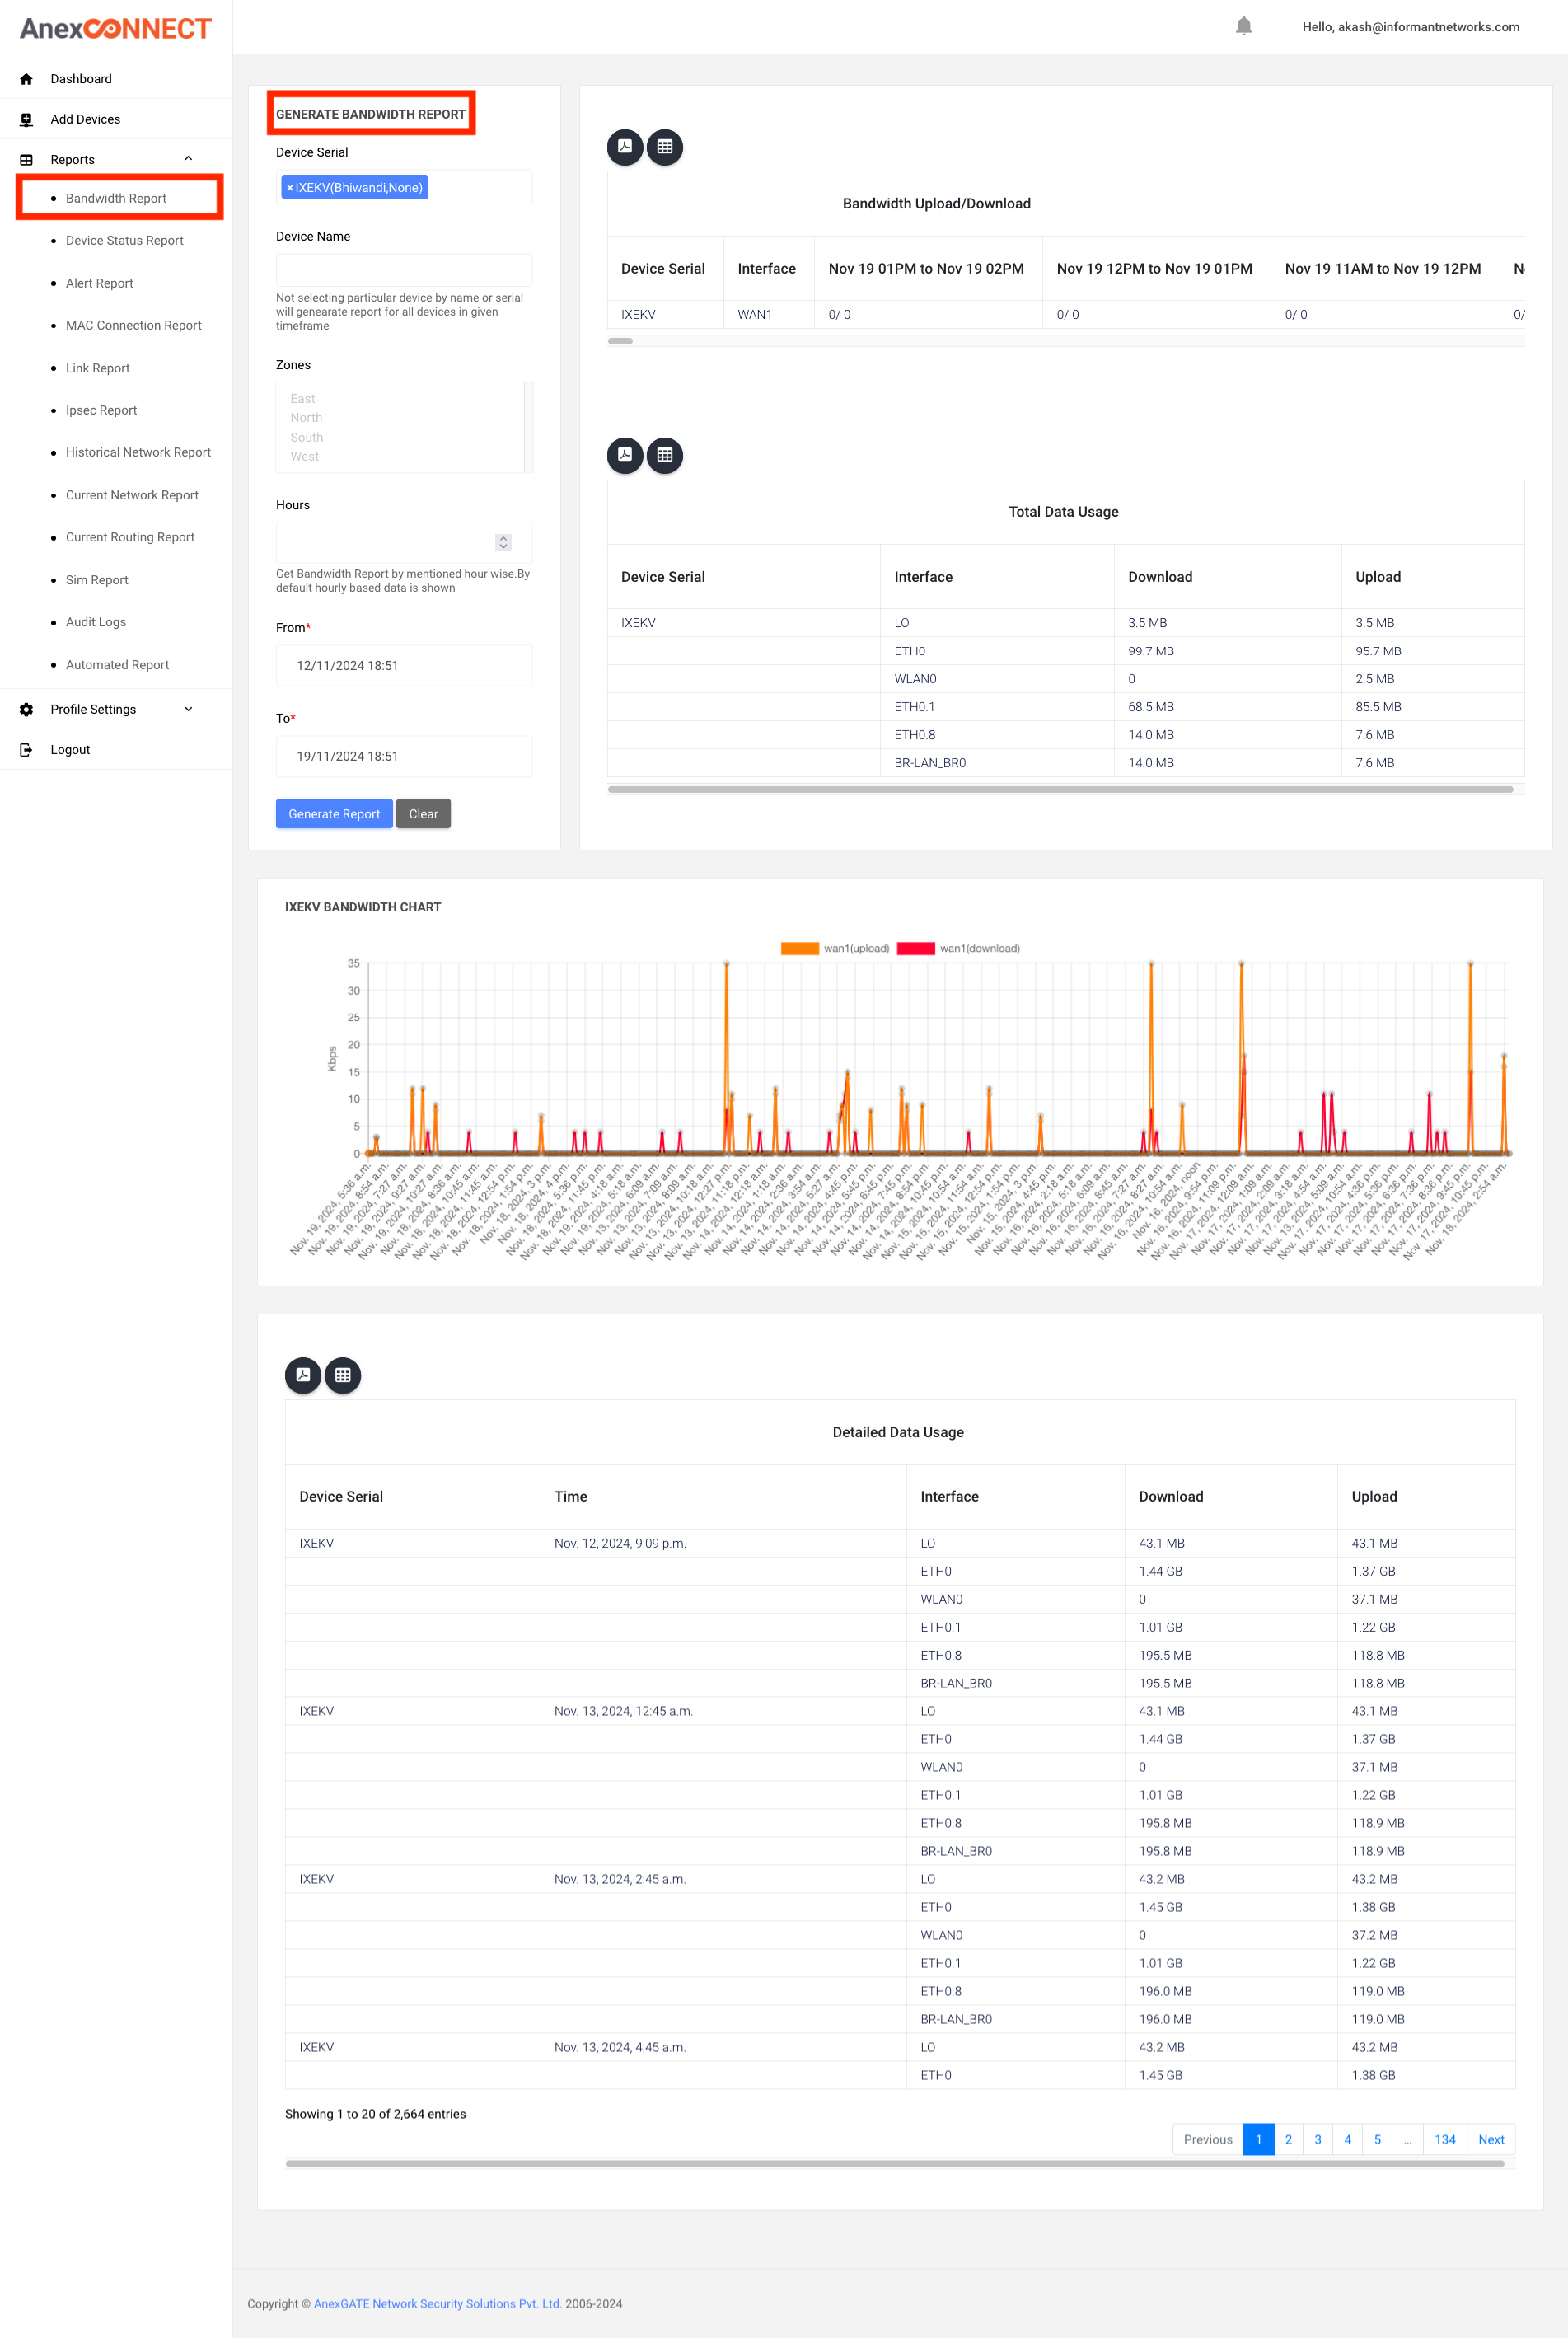
Bandwidth Upload/Download
In this report, all bandwidth speeds recorded within each 1-hour interval are combined, and the average speed for that 1-hour interval is calculated and displayed.
Total Data Usage
The Total Data Usage is calculated by fetching all the data recorded for the selected time period. It aggregates the data usage for that interval and displays the exact total usage during that time.
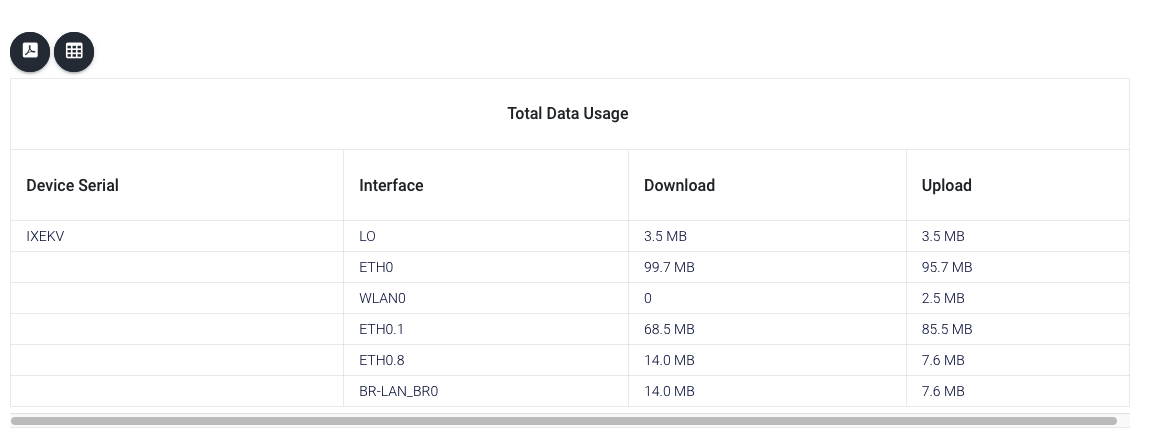
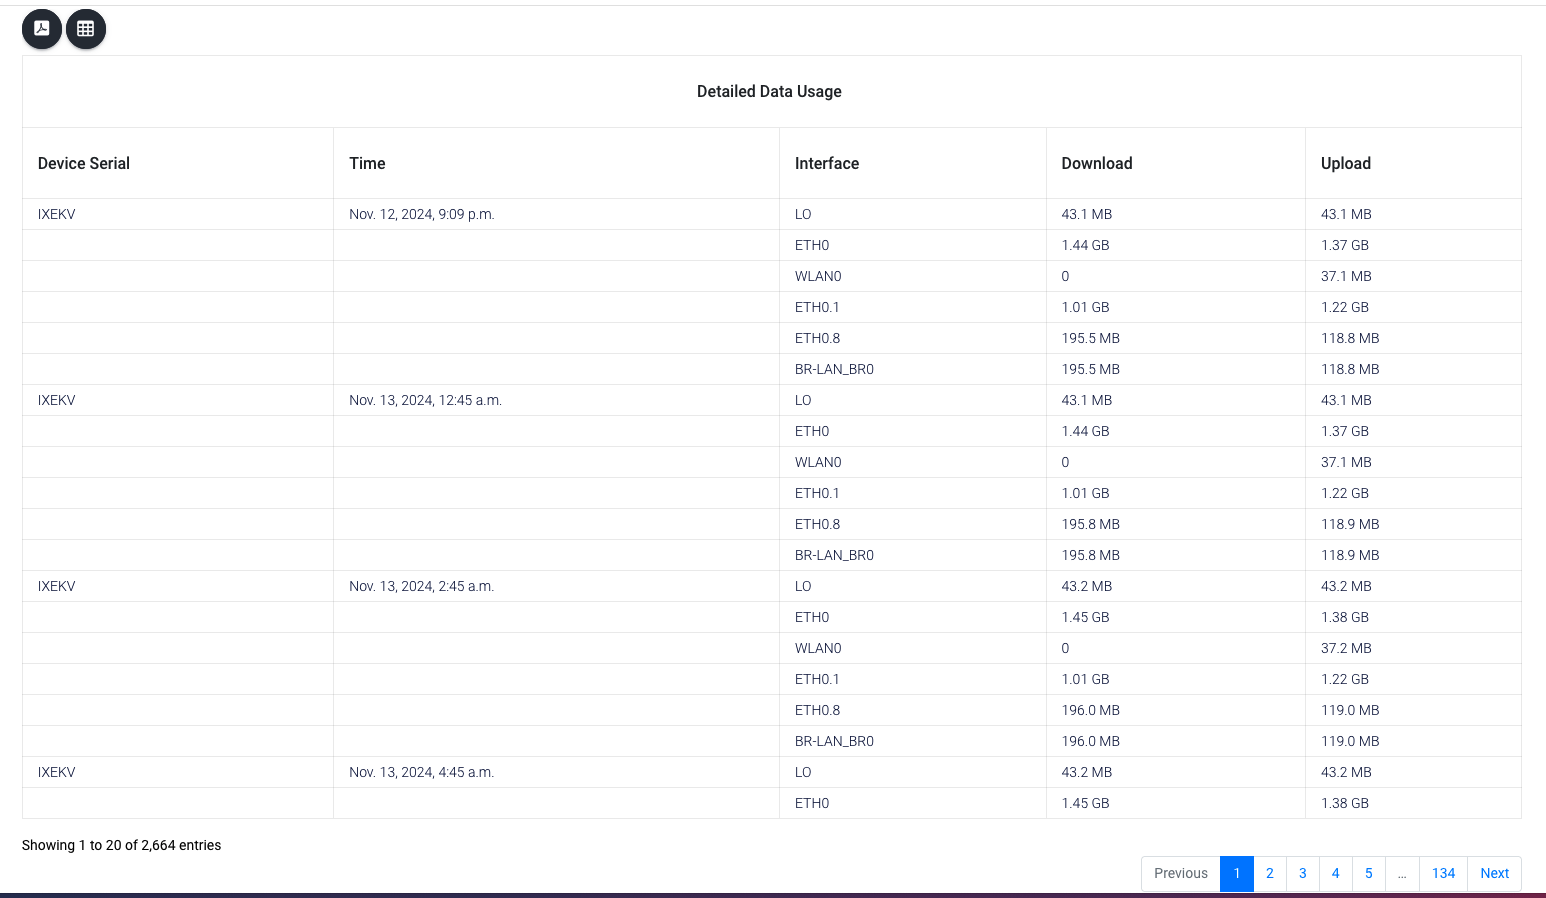
Detailed Data Usage
In this report, you will see the raw data usage sent by the device for each interface.
Key Points:
- The information displayed is exactly as received from the router, without any calculations.
- Every instance of data received during the selected time interval is displayed in detail.The report reflects all the data usage information collected from the router for the specified period.
¶ Device Status Report
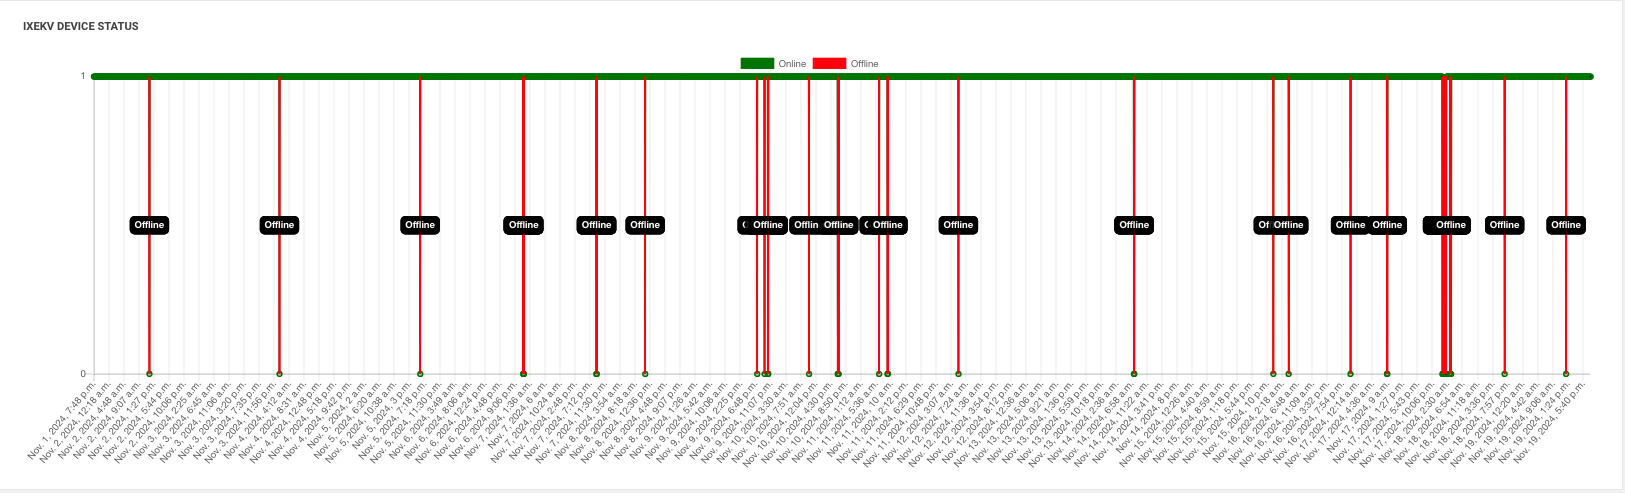
The system provides the device's online or offline status along with a historical report in graphical form and gives exact online and offline time intrerval in report
Graphical Representation:
- A green line is plotted if the device is online.
- A red line is plotted if the device is offline.
Online/Offline Check (Every 15 Minutes):
The NMS server checks every 15 minutes for either of the following:
1.A ping response from the router.
2.Any information received from the router.
If none of these are received within the 15-minute interval, the device is marked as offline.
If any of these are received, the device is marked as online.
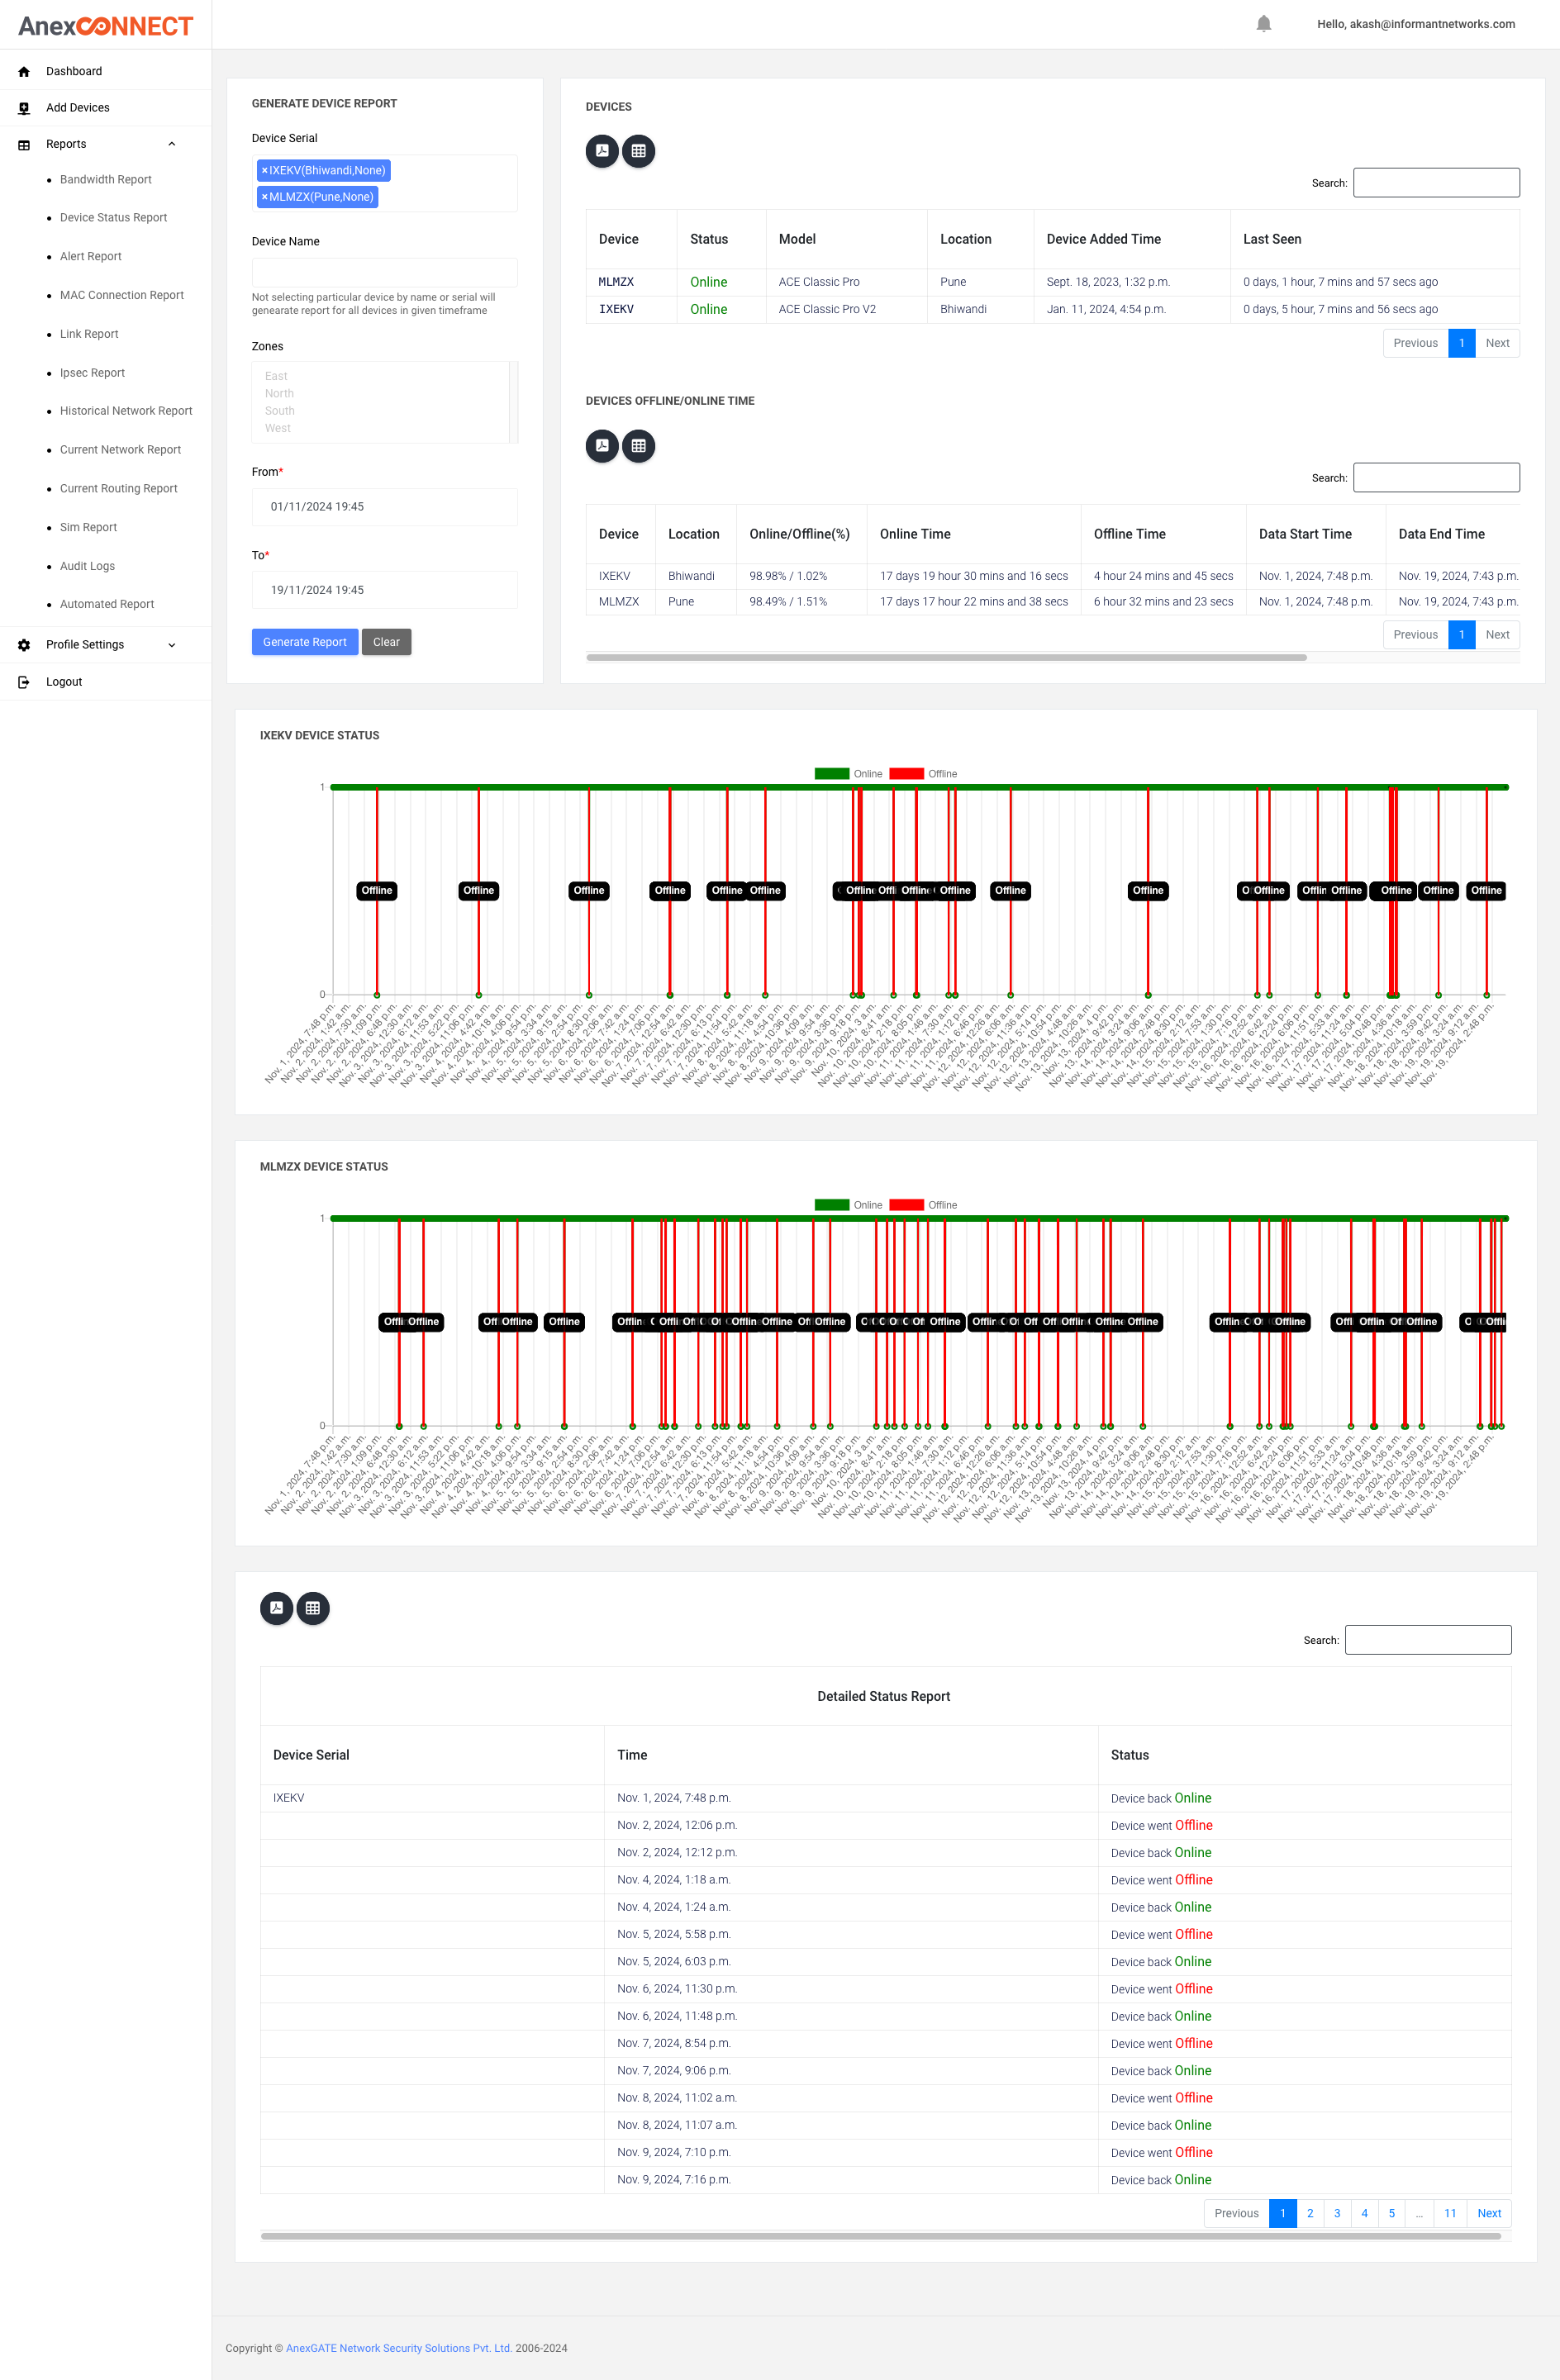
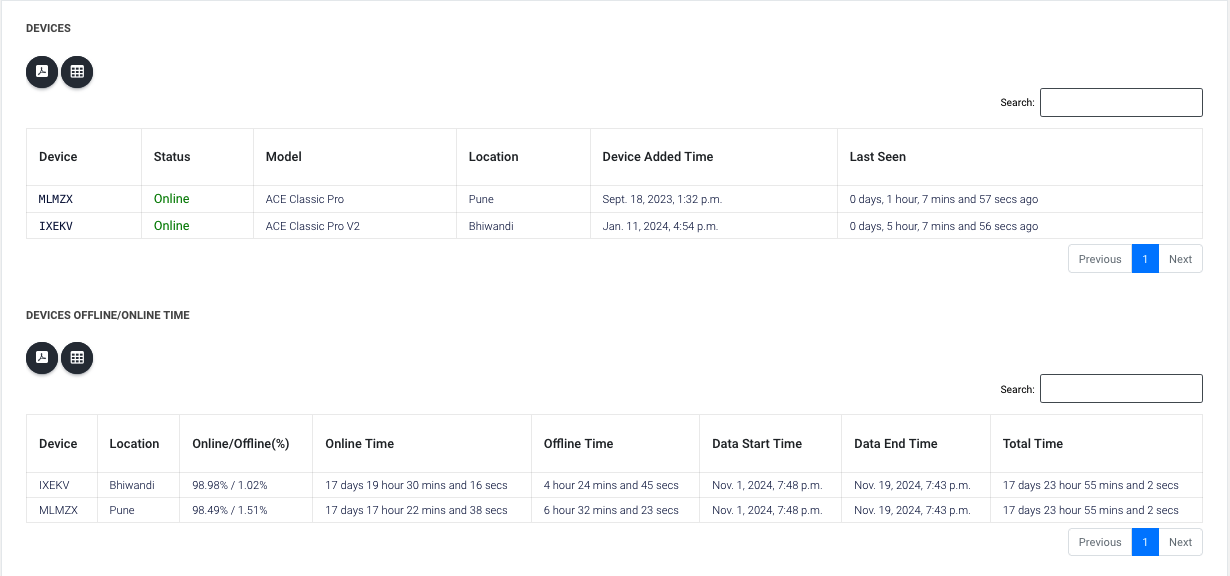
¶ Device (online/offline)
This report provides the following information:
Device Status:
- Shows whether the device is currently online or offline.
- Displays the device's location.
- Indicates the last seen time, i.e., when the device last synced with the NMS server.
Device online/ offline Time Period Analysis:
- For the selected time period, it shows total time the device was online and offline
- Displays the percentage of time the device was online and offline during the specified period.
¶ Device status graphical representation
Online and Offline Status
The graph uses:
- Green bars/lines to indicate the time the device was online.
- Red bars/lines to indicate the time the device was offline.
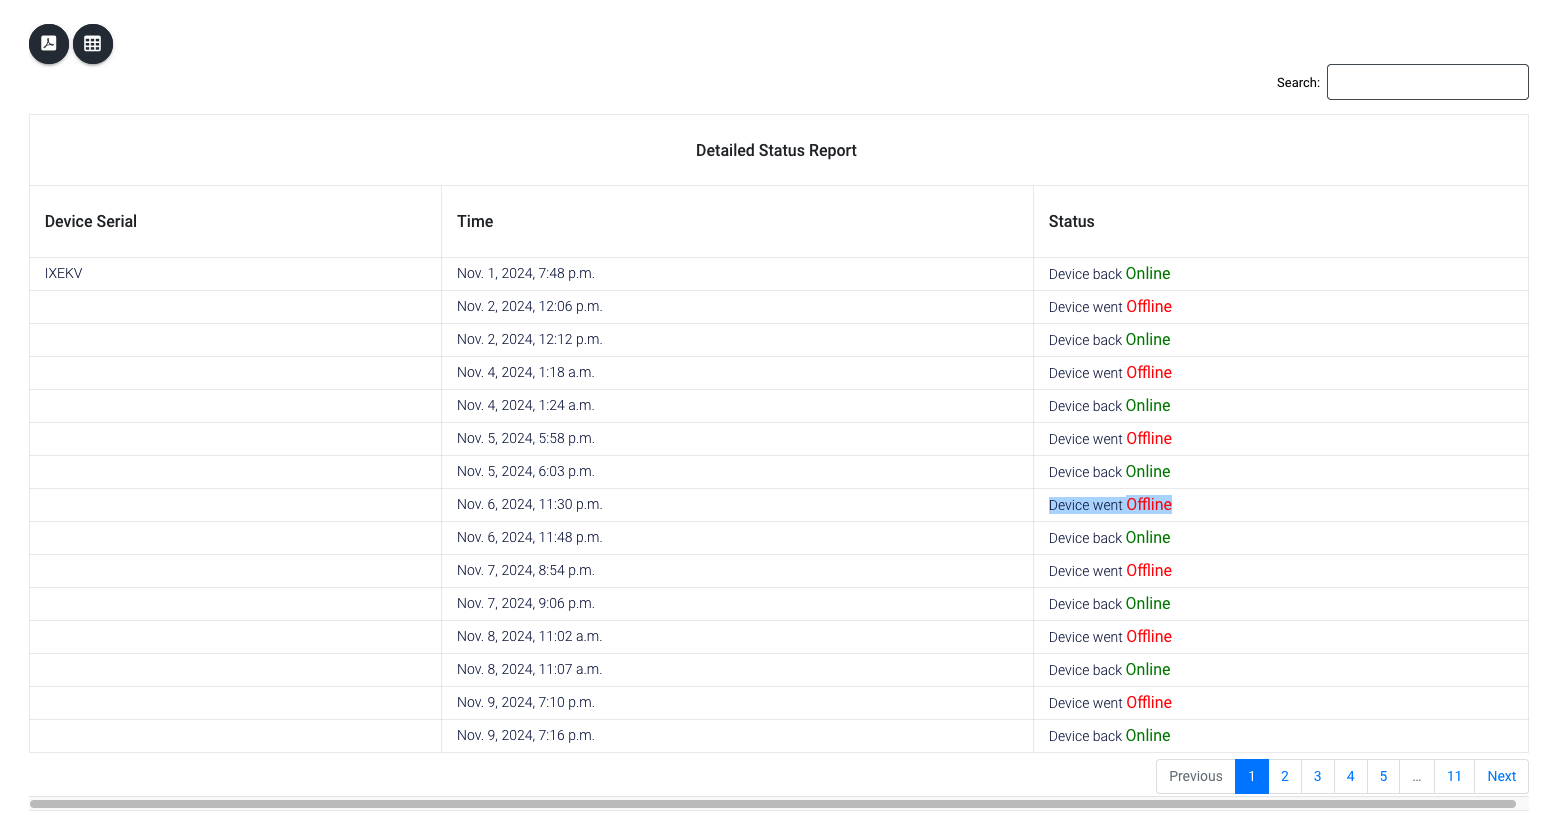
¶ Detailed Status Report
The Detailed Status Report provides the following information:
Exact Online and Offline Times:
Displays the exact date and time when the device came online and went offline during the selected time period.The Online and Offline Parameters match accurately with the graphical representation provided in the graph report.
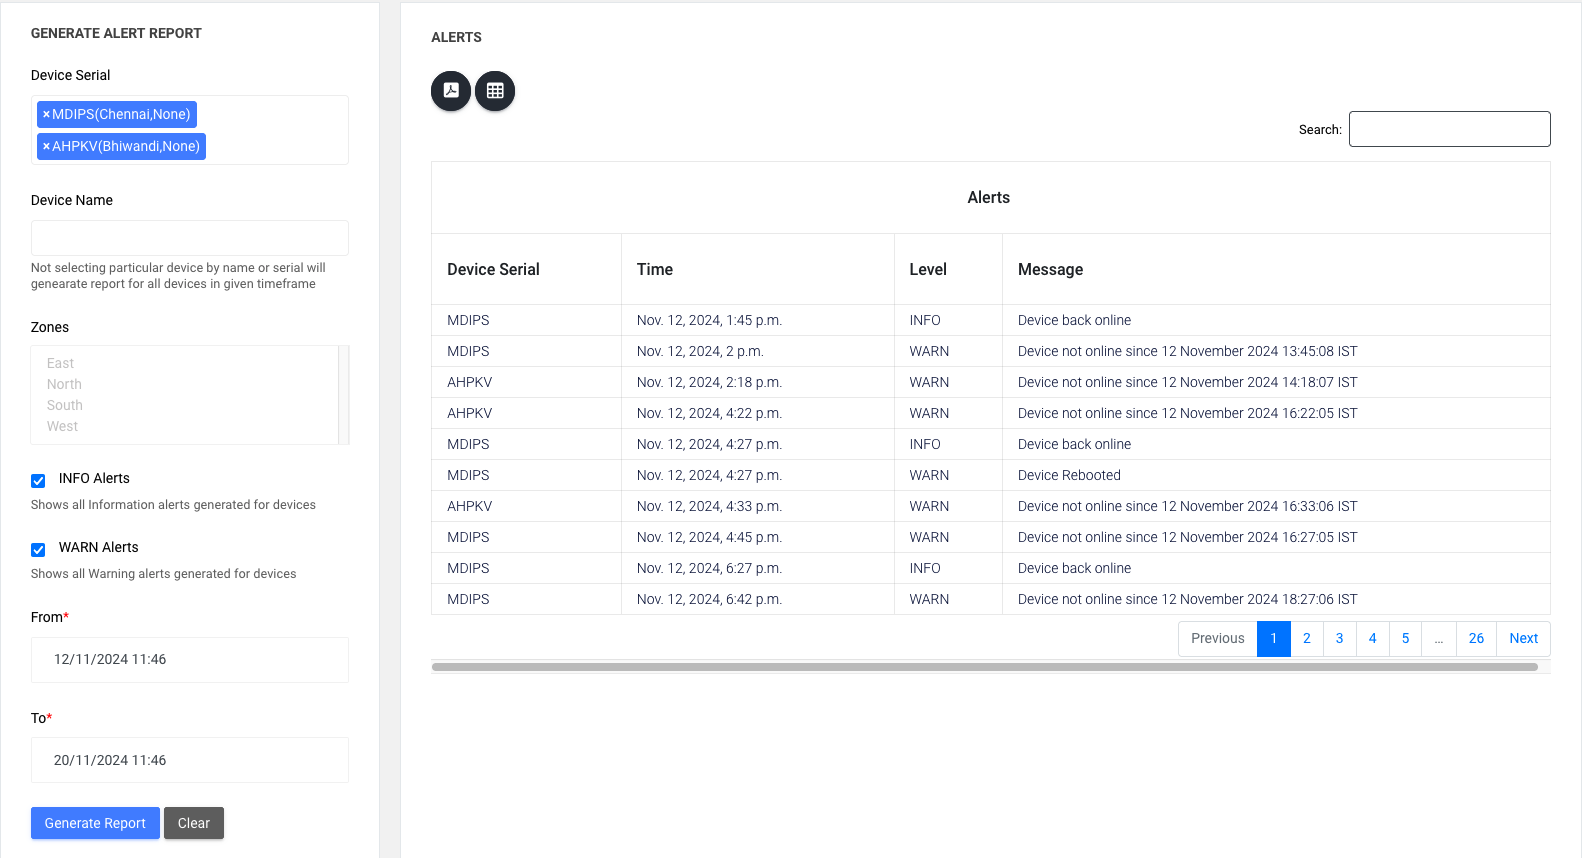
¶ Alert Report
The Alert Tab provides two types of alerts:
Info Alerts:
These alerts provide real-time notifications for events such as:
- Device online or offline status.
- Device reboots.
- Interface up/down status.
Warn Alerts:
- These alerts are triggered for extended issues, such as:
- Device being offline for a certain number of days or hours.
- Interface being down for more than a specified duration'
Warn alerts prompt you to check the device or interface for potential issues.
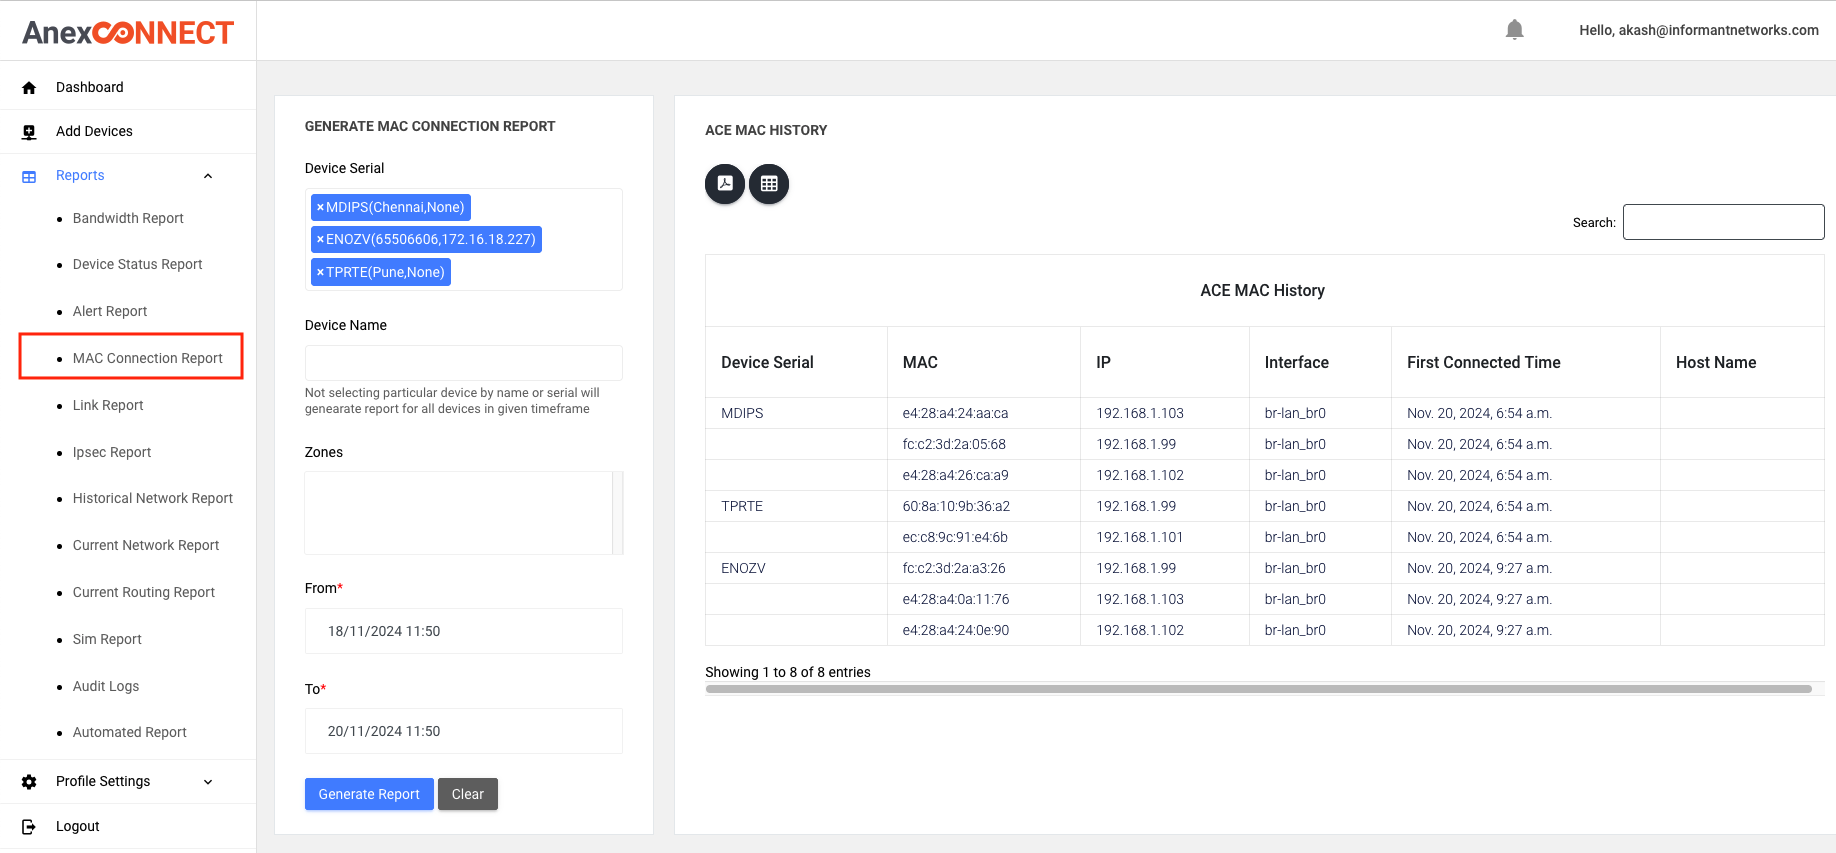
¶ MAC Connection Report
The MAC Connection Report provides the following details for the selected time period:
Connected Devices:
Shows how many devices connected to the router during the specified time period. Lists the MAC addresses of these devices along with IP address assigned with that MAC, it will show last IP address assigned for that respective MAC address
Summary:
Provides a complete overview of The number of MAC addresses connected to the router with IP addresses assigned to each device.
This report helps in understanding device connectivity and IP address distribution during the specified timeframe.
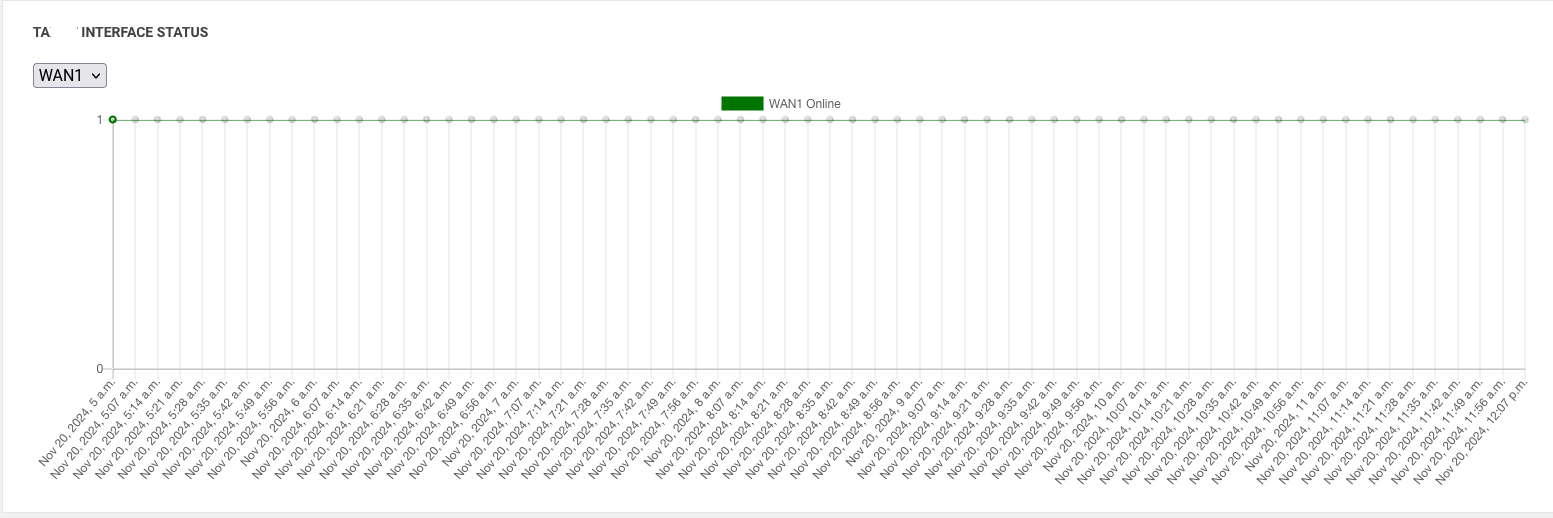
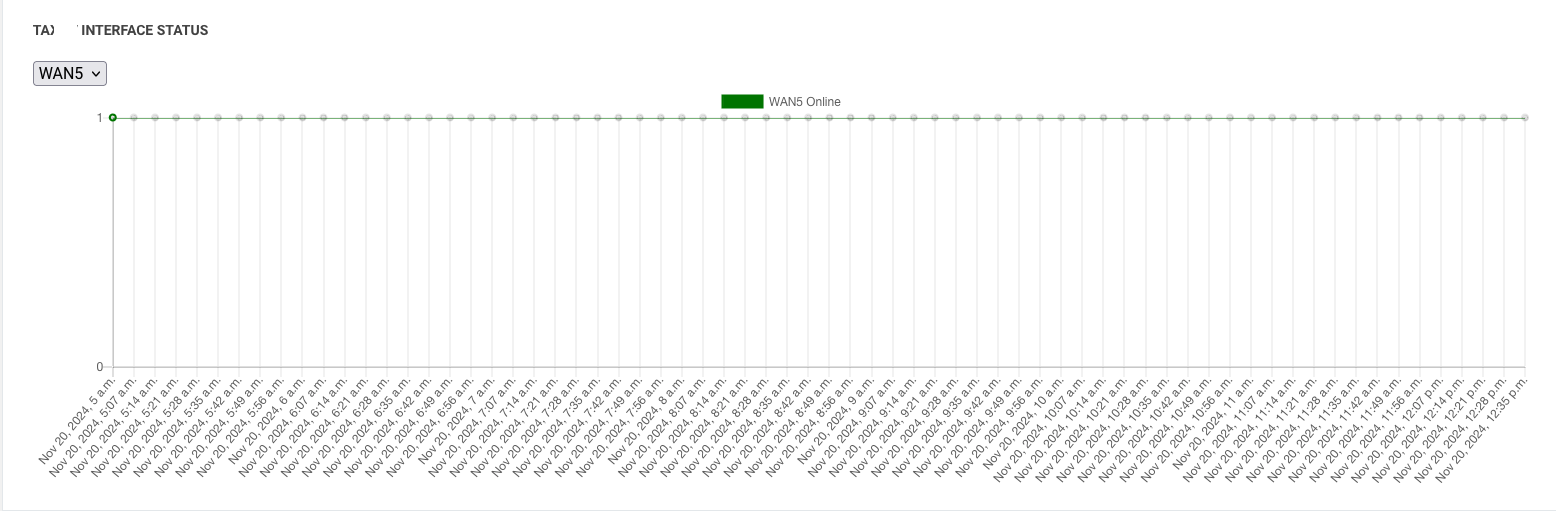
¶ Link Report
The Link Report is available only when Multi-WAN is enabled on the ACE router.
This report helps in analyzing the performance and uptime of each interface along with their tracking IP latency statistics. it will prove online/offline repoert with tracking ip and there latency in exel and PDF format
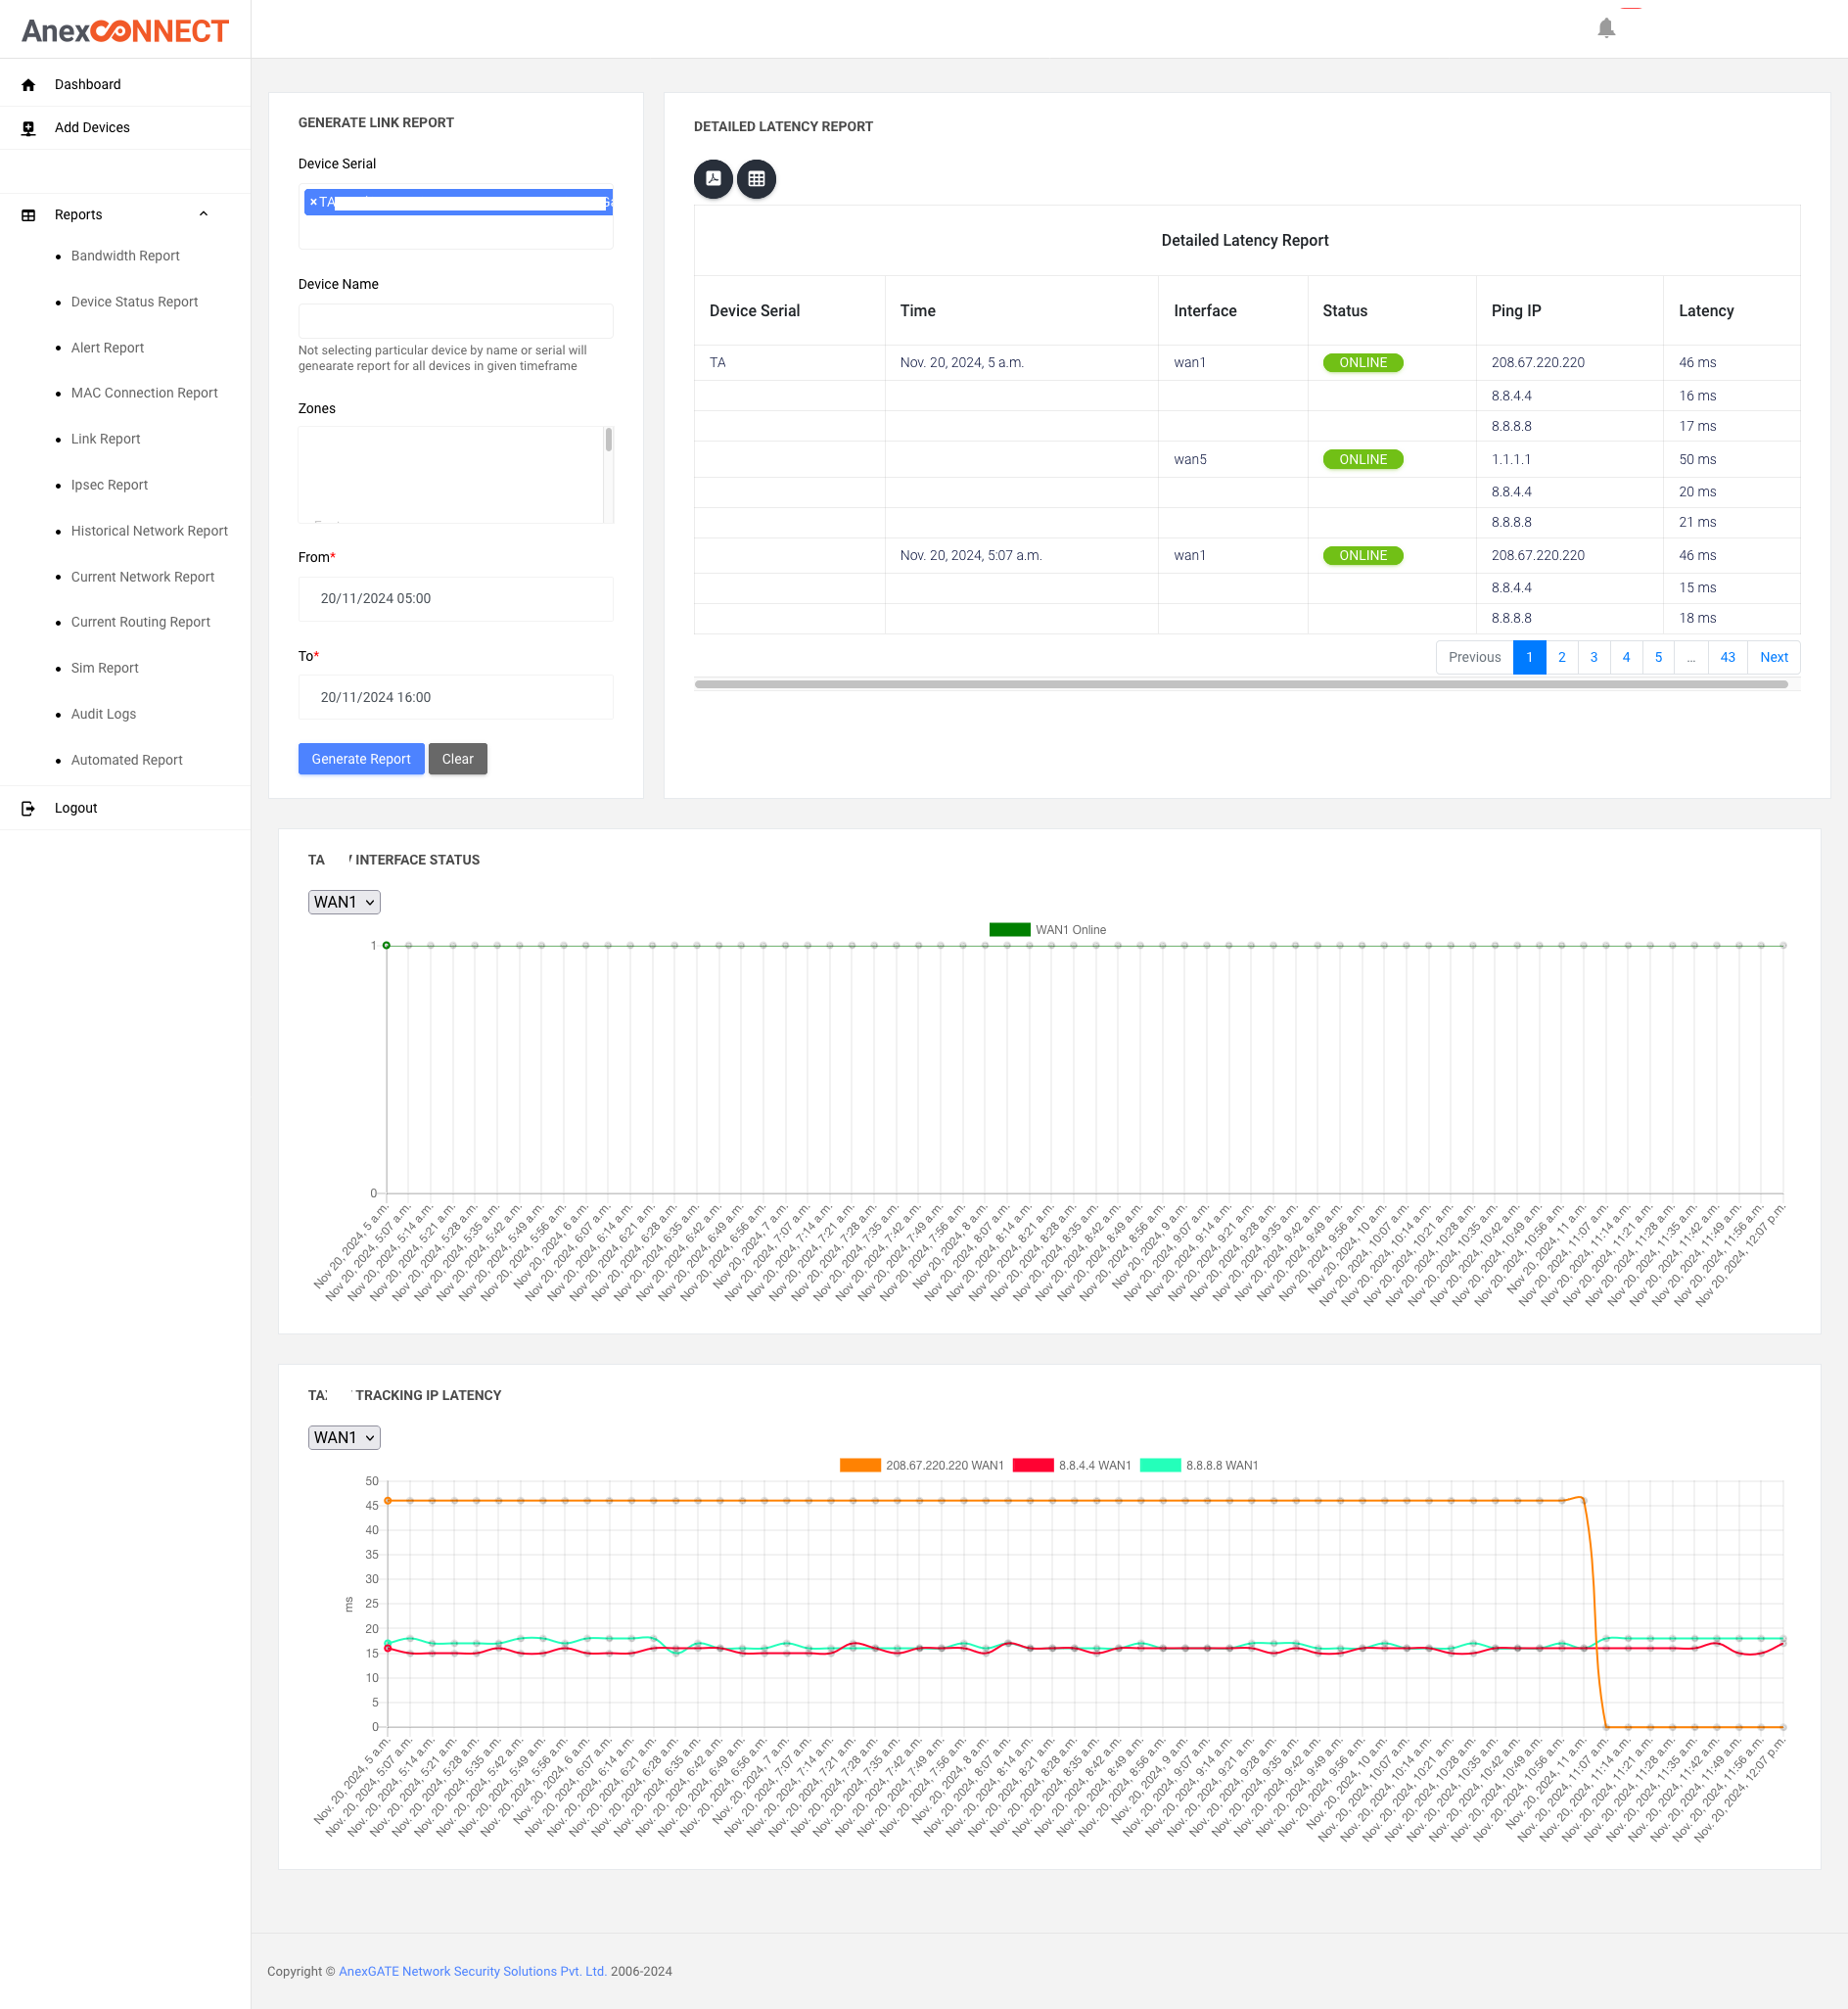
Key Features
Tracking IPs for Interface Monitoring:
In Multi-WAN, specific tracking IPs are configured to monitor the status of each interface (online or offline)The router checks these tracking IPs at regular intervals (e.g., every minute) based on the configured time period and givens how much time inteface is online and offline , you can select respective wan interface to check there each interface status
Ping Latency Storage:
The router stores the ping latency of the tracking IPs during the monitoring process.
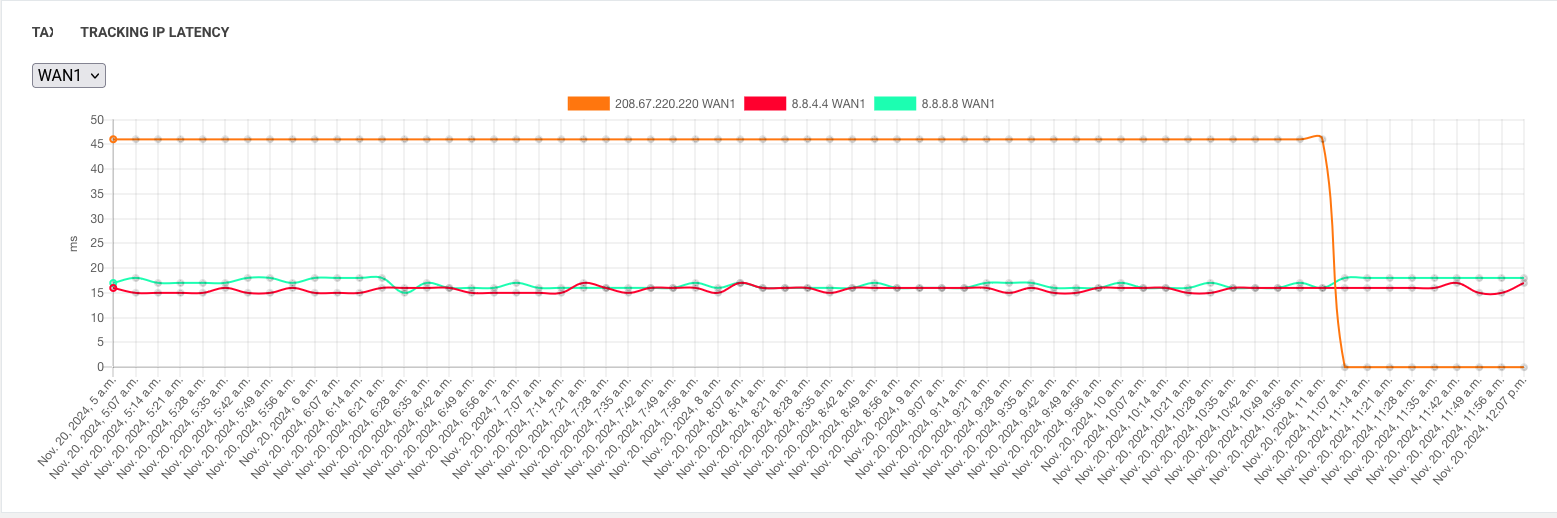
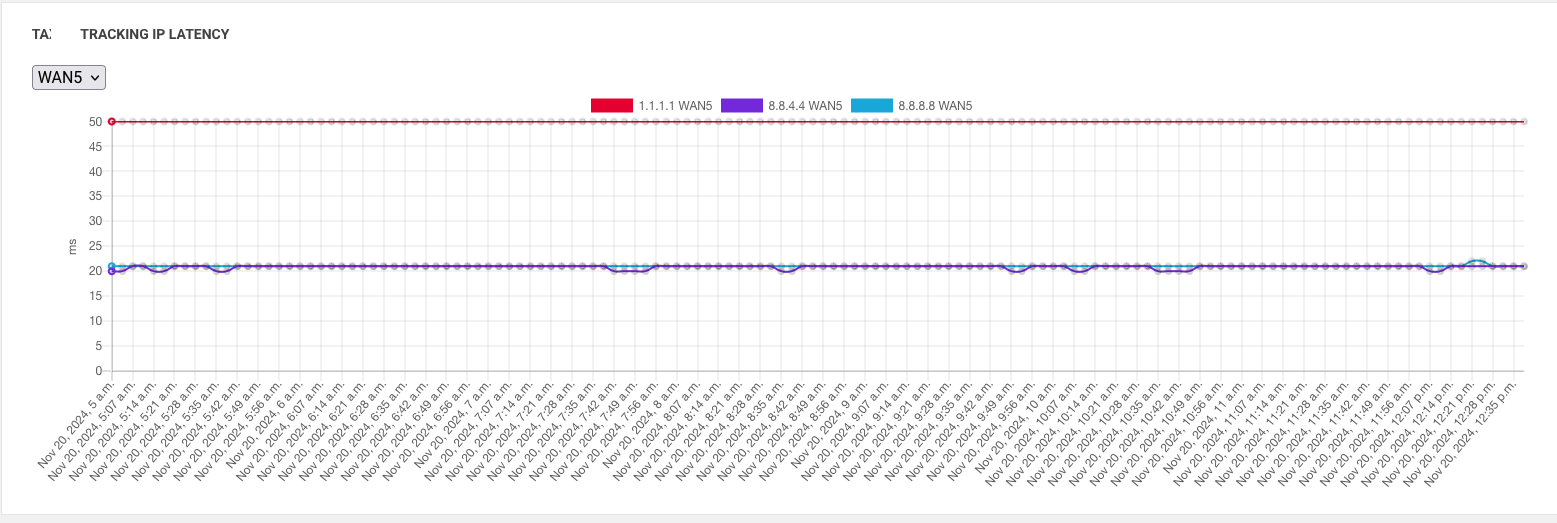
The report provides: The exact online and offline times for each interface.
Latency details for the tracking IPs during the selected time period.
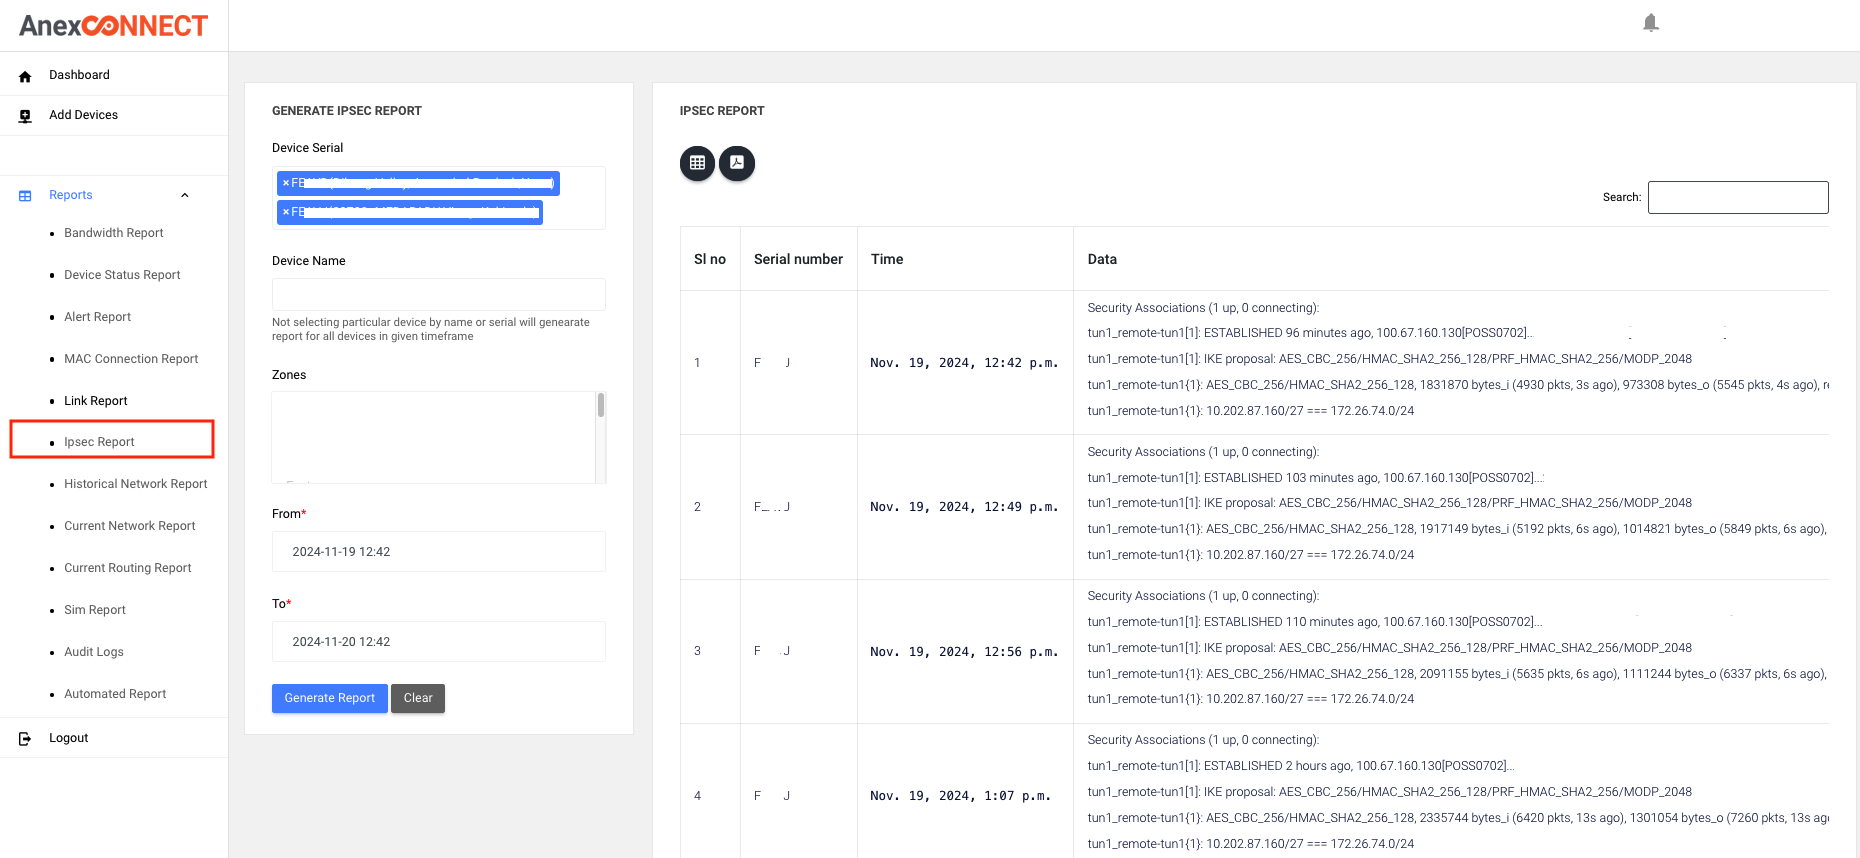
¶ Ipsec Report
The IPSec Report provides detailed information about the IPSec tunnel status during the selected time period.This report is useful for tracking the stability and reliability of the IPSec tunnel.
Key Features:
Captured IPSec Status:
During the search time period, whenever the ACE router sends information to the NMS server, it captures the IPSec tunnel status at that time.Each captured status is recorded and displayed in the report with time interval we recived .
The IPSec status report shows whether the tunnel is up or down. If the tunnel is up, it will display the tunnel establishment details, including the Security Association (SA) and the encryption method used
Helps you analyze how consistently the IPSec tunnel was operational during the selected timeframe.
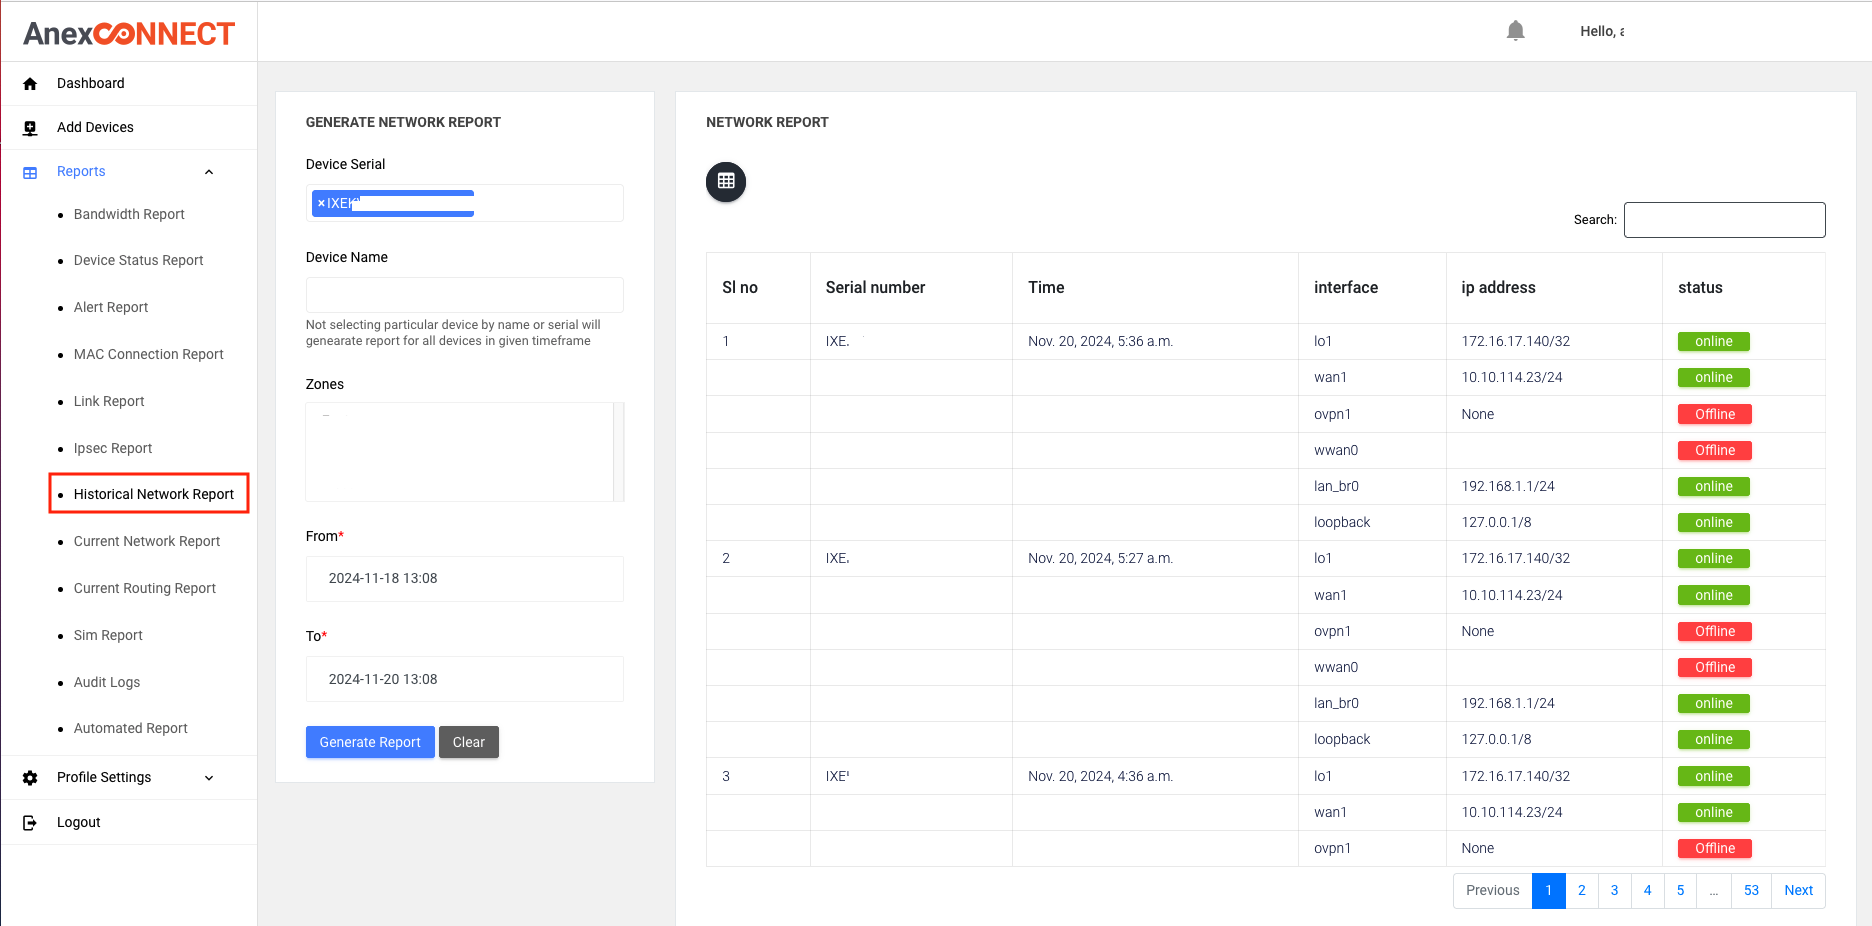
¶ Historical Network Report
The Historical Network Report provides the following details for the selected time period, This report helps track the device’s network status and IP assignments over time.
Network Information:
Displays all the network details received from the ACE router to the NMS server during the specified time period.
Device Status:
Shows whether the device interface was online or offline during the reporting period.
IP Details:
Lists all the IP details related to the device interface during the selected time interval.
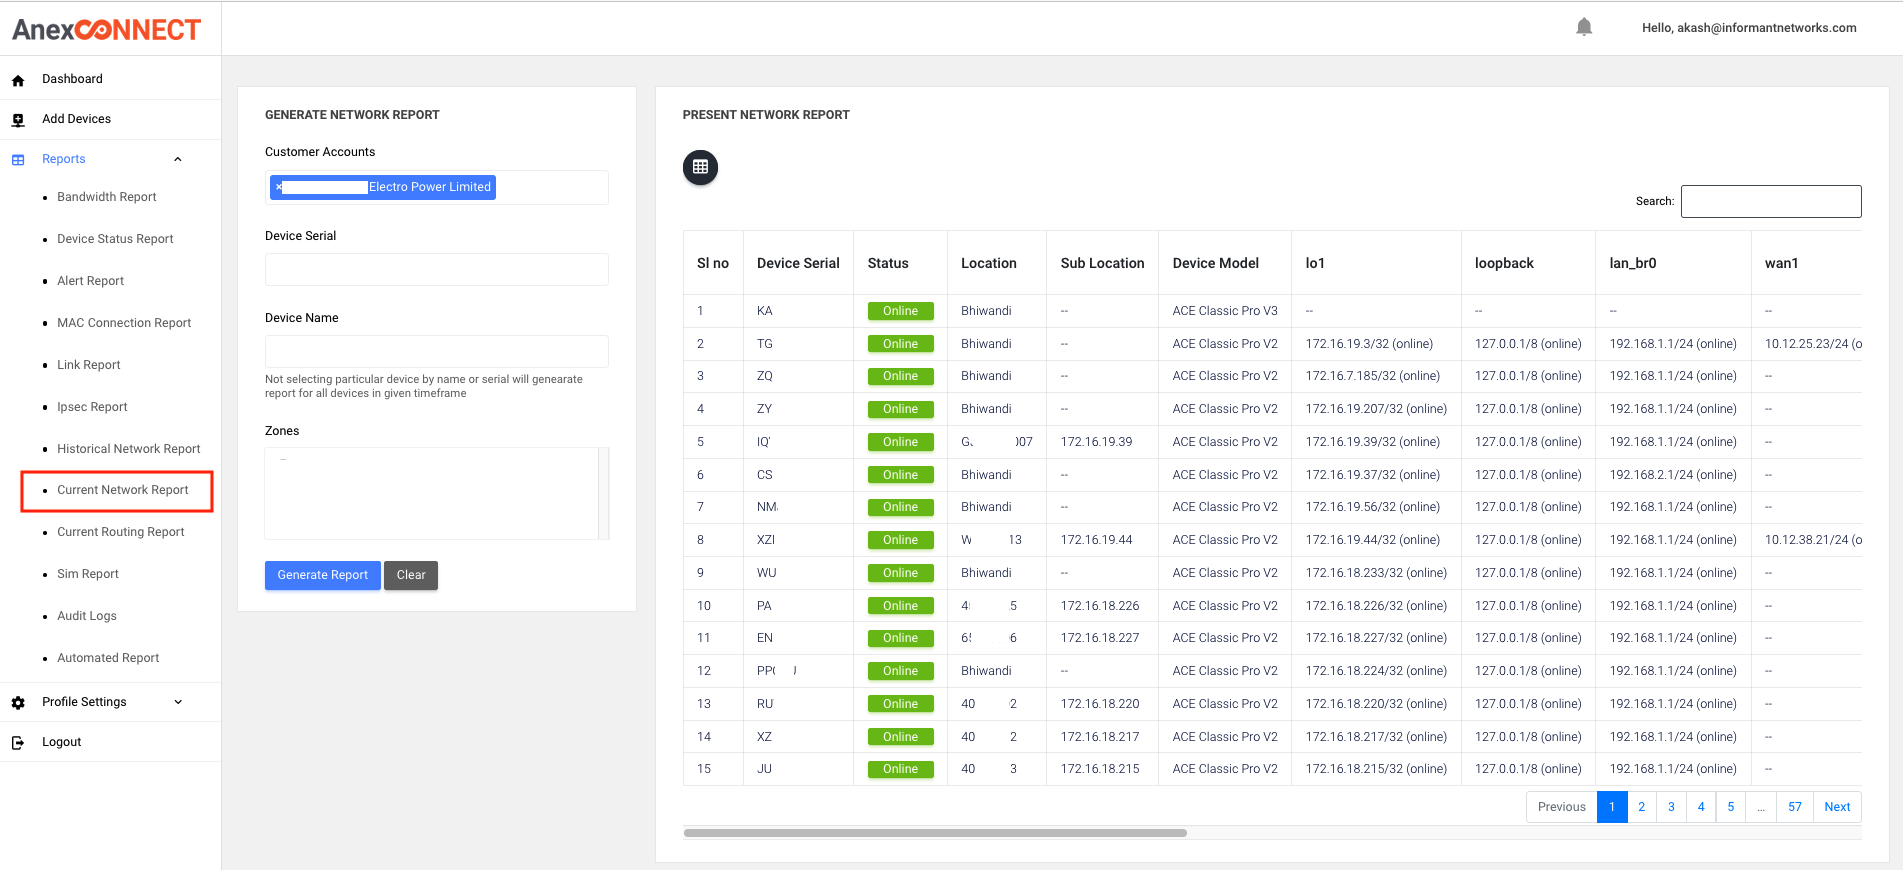
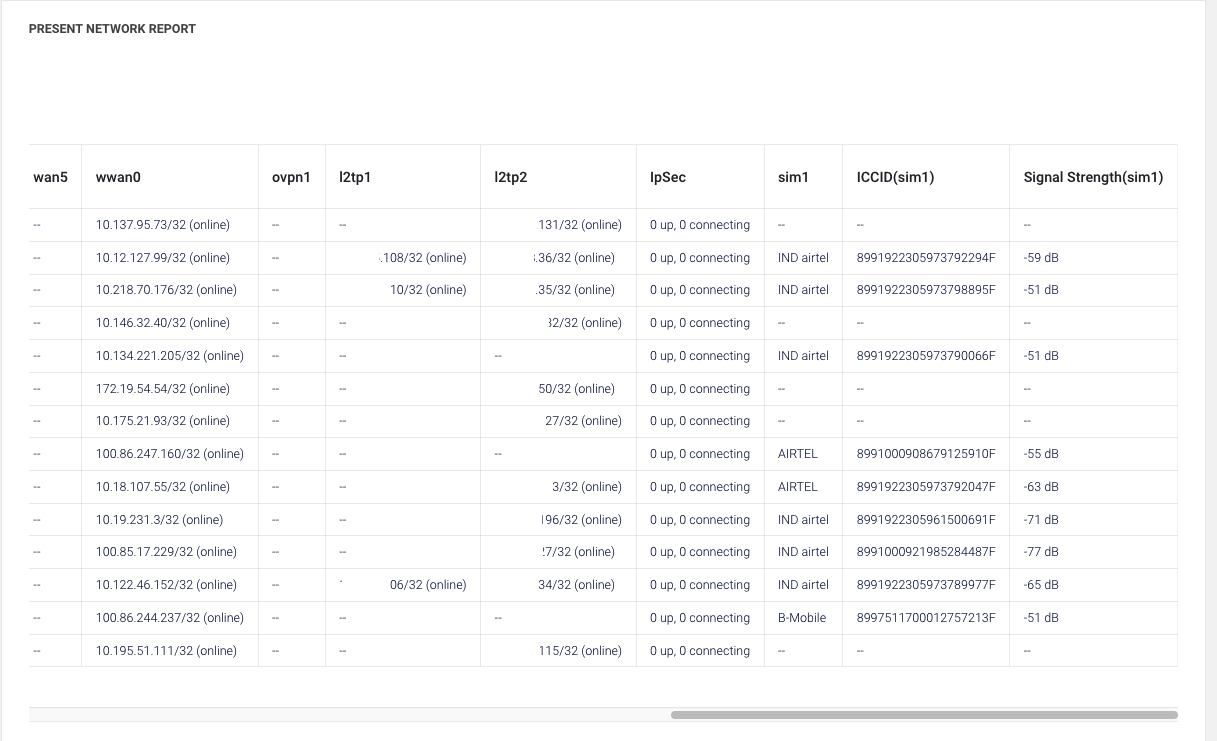
¶ Current Network Report
The Current Network Report provides the network status for all routers under the selected customer.
This report gives a comprehensive overview of the network status with IP details, including connectivity, licensing, and device specifics for each router. which device is online and offline on present state it will show in this report
Key Features
Customer Selection
You can select a customer, and the report will display all devices associated with that customer.
Network Details
Includes LAN, WAN, Loopback, and VPN IP details.
SIM Information
Displays the SIM number and signal strength for each router.
IPSec Status
Provides the IPSec status for each router weather ipsec tun is up or down
License Key and Location
Shows the license key and location details of each router within the selected customer.
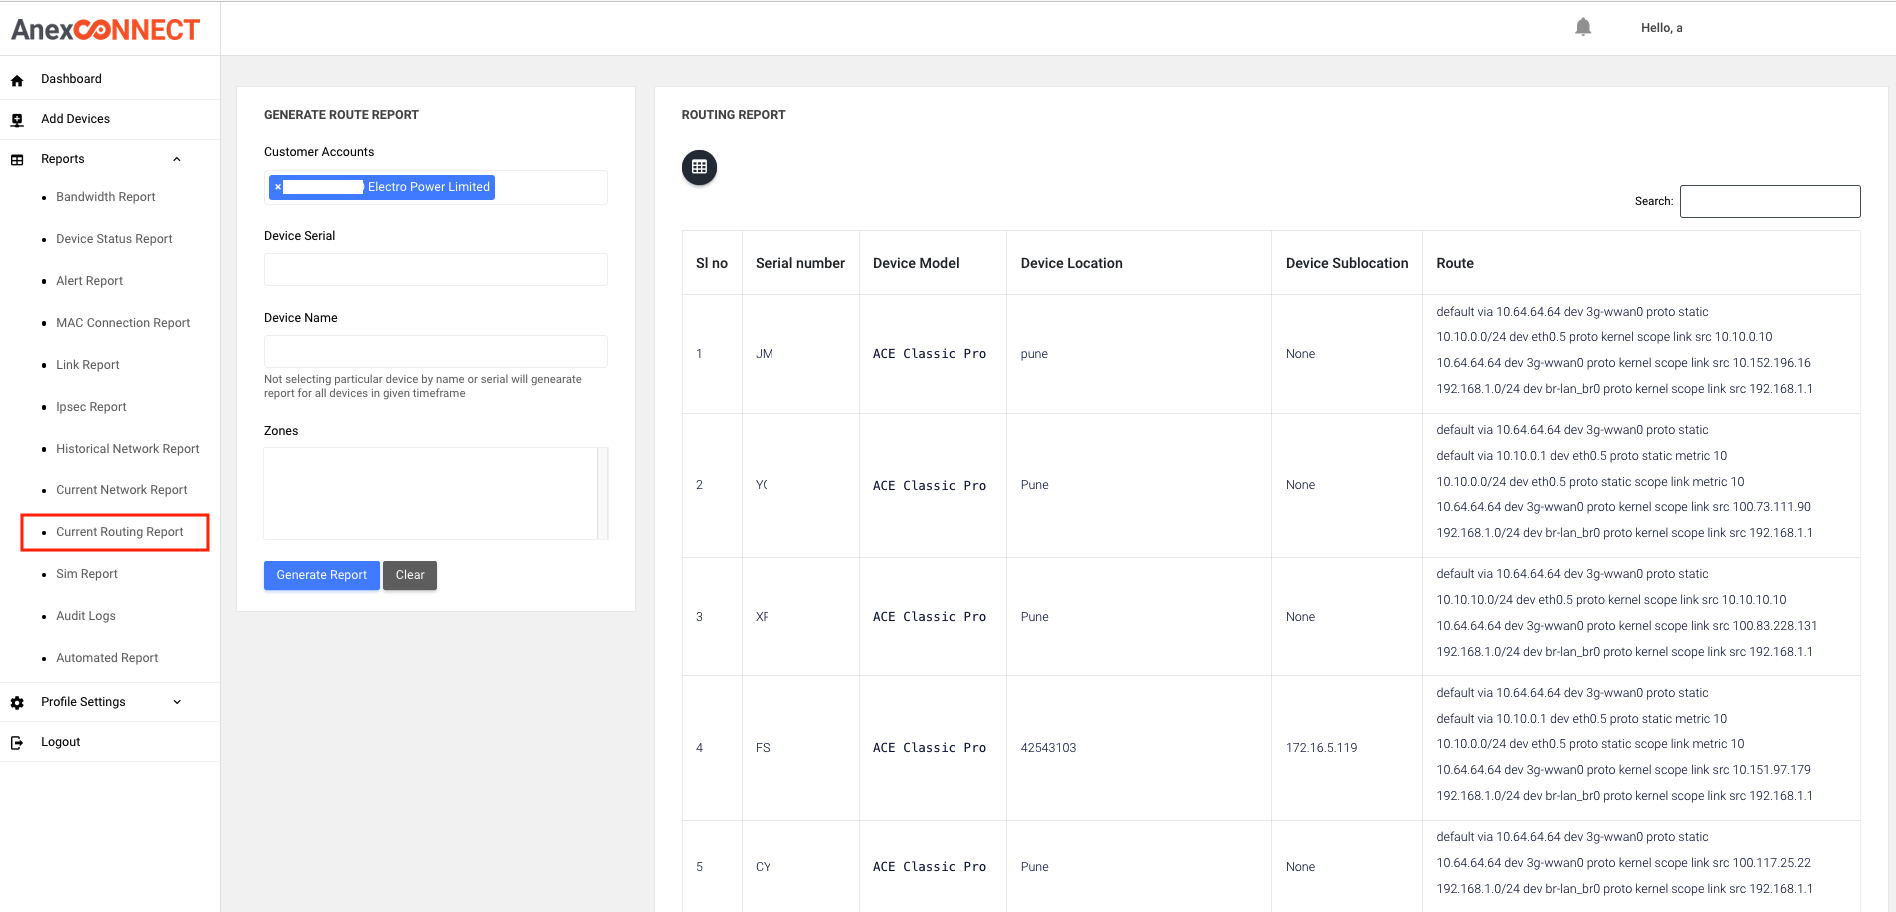
¶ Current Routing Report
The Current Routing Report provides the default routing table of each router from the last information received from the router to the NMS server, along with device location, sublocation, and device serial number.
you can search report by customer wide you will get all router report in that customer at ones
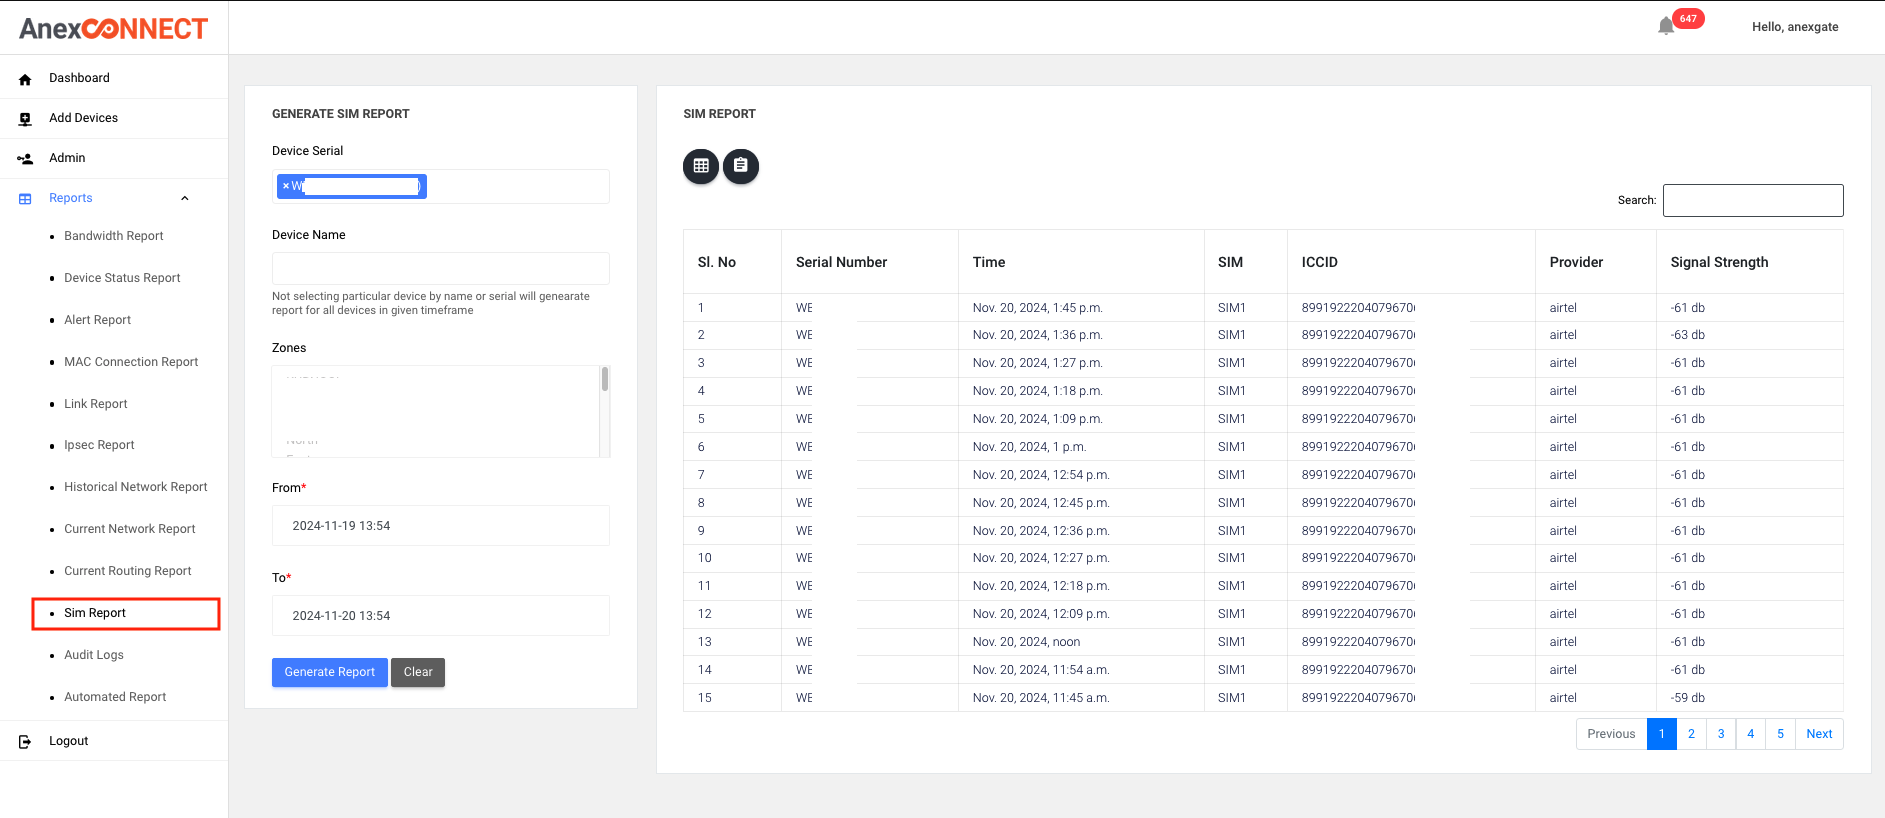
¶ SIM report
The SIM Report provides detailed information about that SIM in the router during the selected time period. its include SIM number , SIM provide , SIM signal strength , historical all details will show for specific device
Key Features
SIM Changes Tracking:
Helps observe if any SIM changes occurred in the router during the search time period.
SIM status
This report allows tracking of SIM status and changes in routers, as well as monitoring signal strength over time.
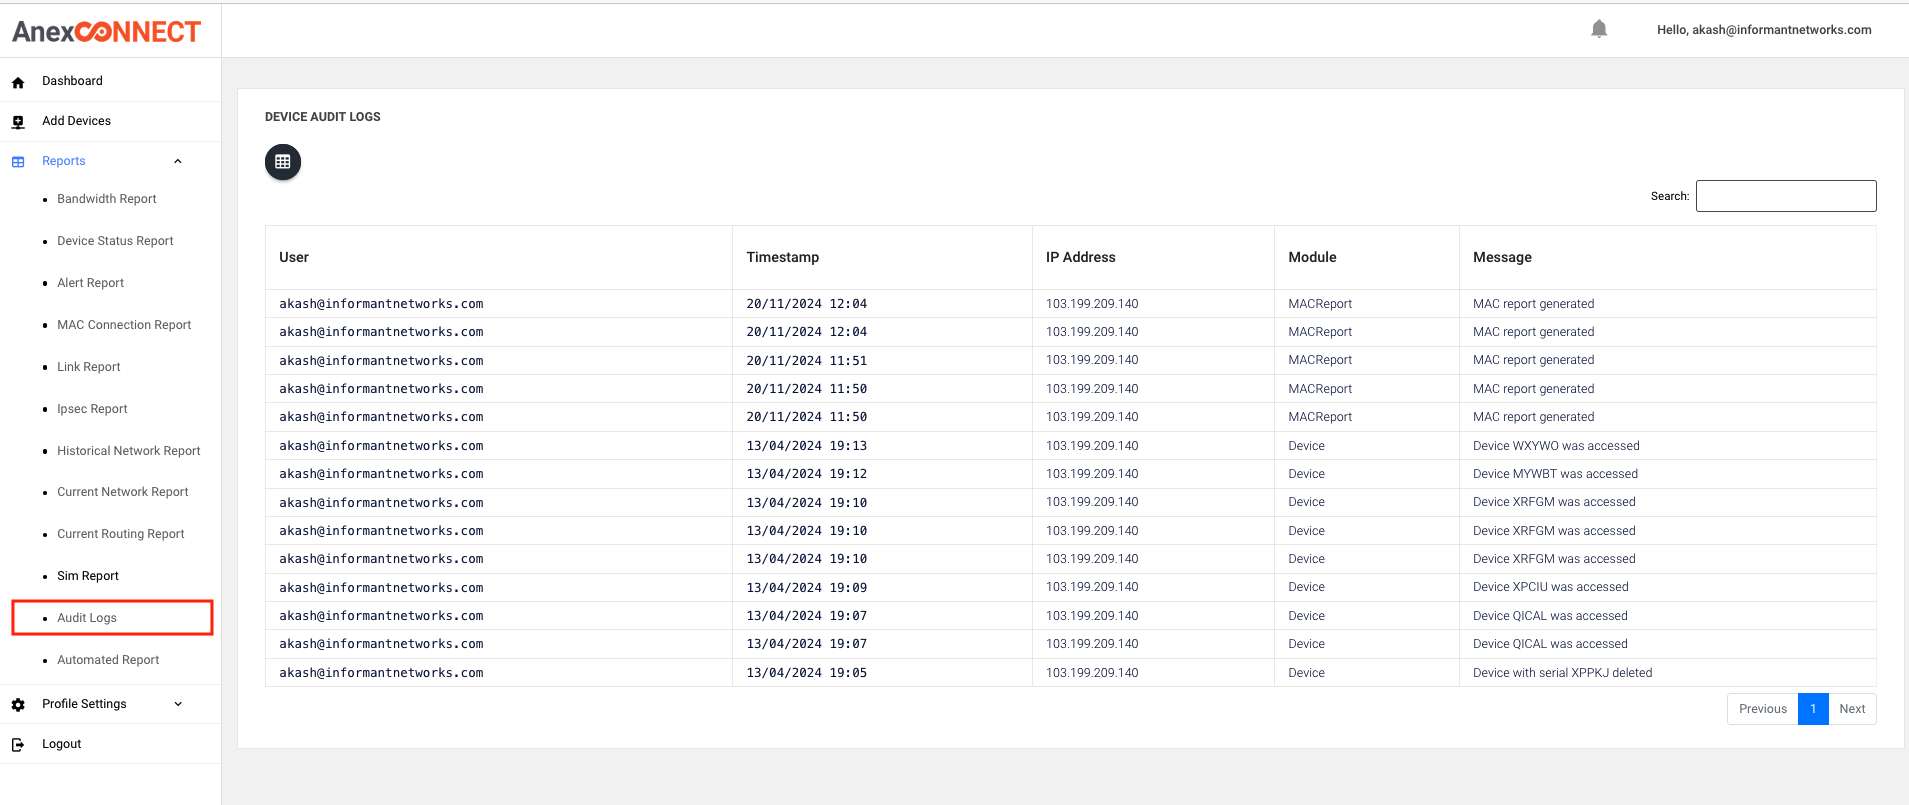
¶ Aduit log
The Audit Log provides the following details:
-
User Login Information:
Tracks which user logged into the NMS server. -
Actions Performed by User:
Shows what reports the user opened, any devices logged in, or devices deleted. -
Date and Time:
Provides the date and time of each action performed by the user. -
Public IP Address:
Displays the public IP address from which the user accessed the NMS server.
This log helps track user activity, including actions taken within the system, and provides detailed security and audit insights.
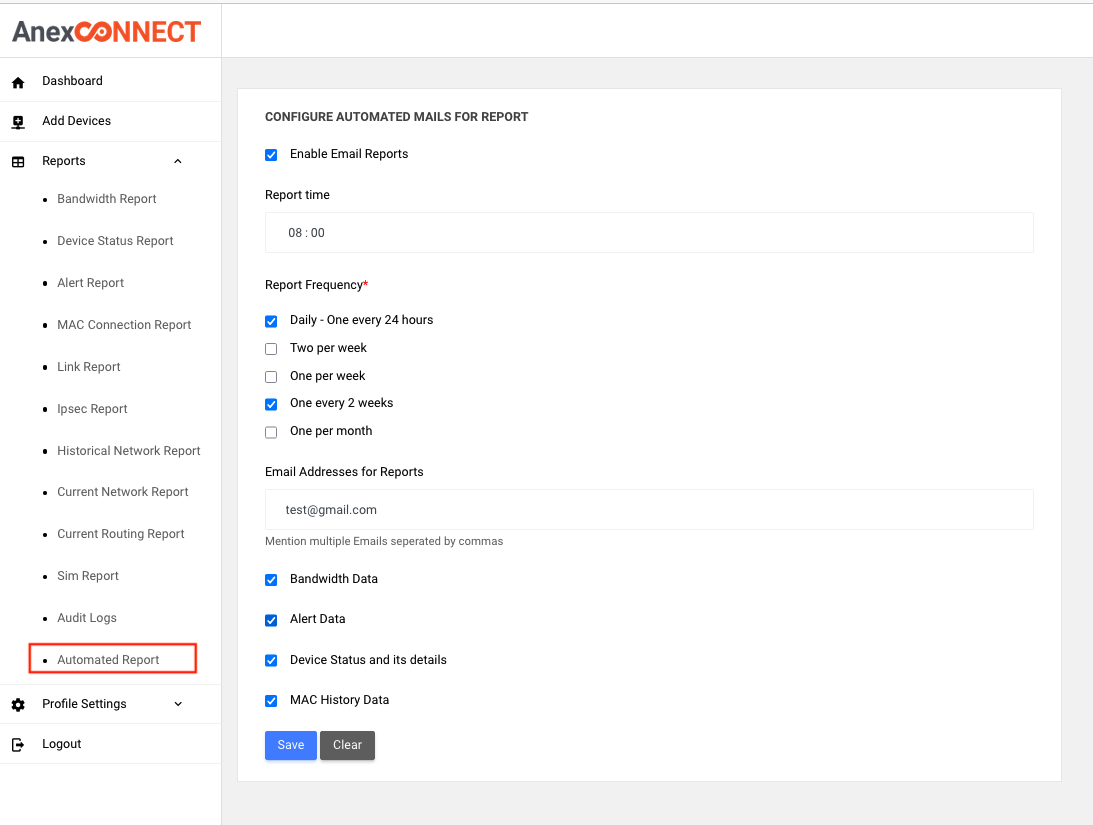
¶ Automeated Report
The Automated Report feature provides the following reports:
- Bandwidth Data
- Alert Report
- Device Status Report
- MAC History Report
These reports can be scheduled to be sent daily, weekly, or monthly to the specified email addresses on selected time period . You can provide multiple email addresses, separated by commas, to receive the reports.
¶ Profile Setting
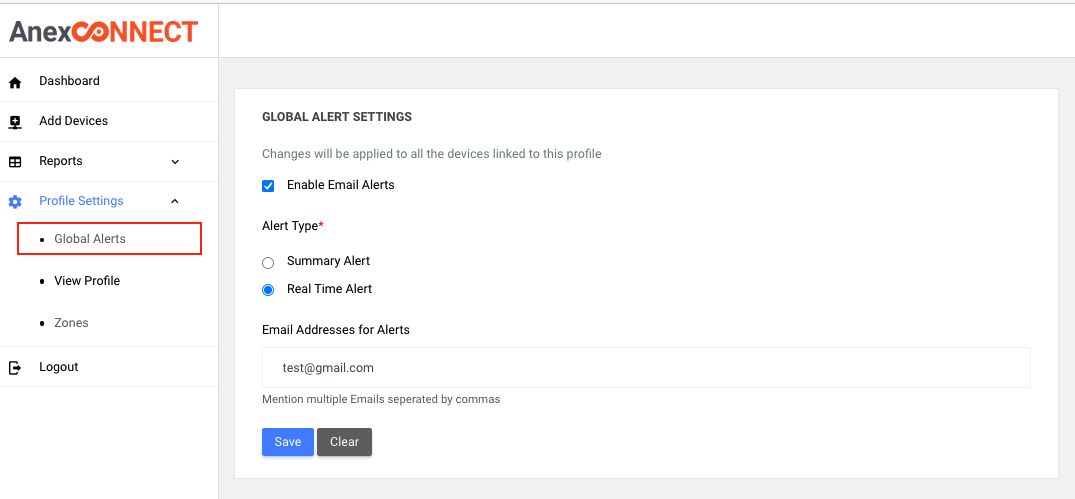
¶ Global alerts
It will genarte info and warn alarts of all deivce in customer at ones, you can enbale these alart at single config for all device
This feature helps you stay updated on device alerts and performance any action related to this
Key Features
Real-Time Alerts
You can receive real-time alerts for all devices as they occur.
Summary Alerts
You can receive a summary of all info and warn alerts for a specified time period daily mentationed time period
Email Notifications
All alerts are sent to the respective email addresses you specify, and you can provide multiple email addresses, separated by commas.
¶ Manage user
In the Manage User tab, you can user for Management:
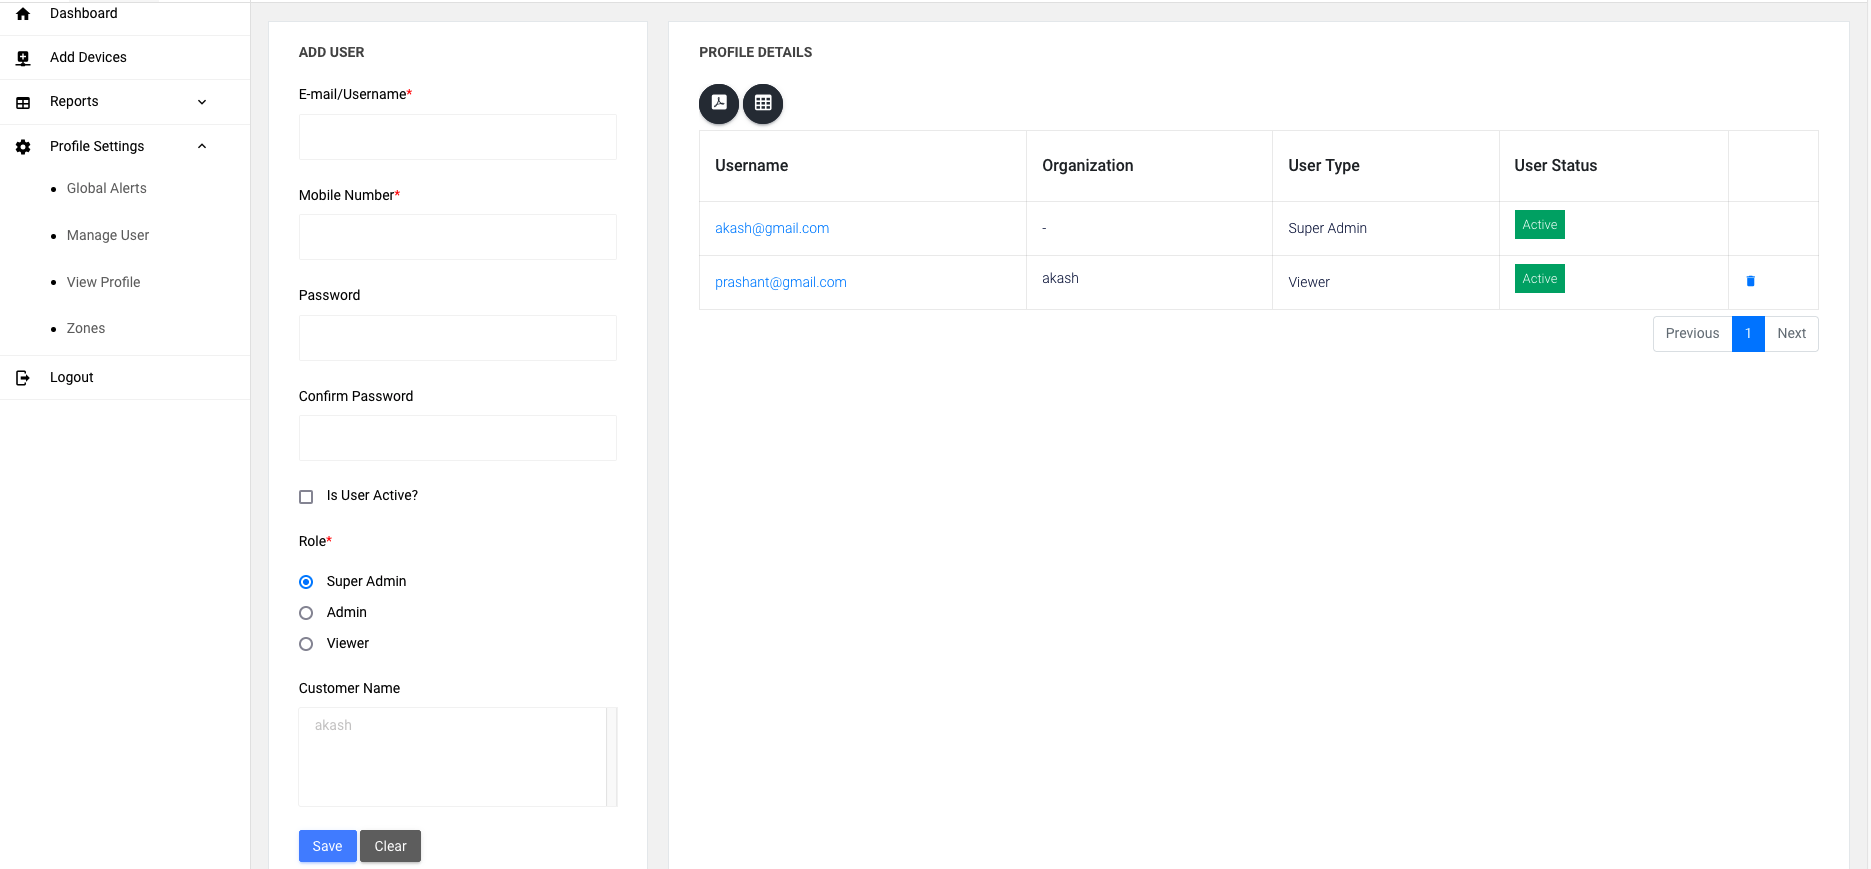
Create Multiple Users:
Provide the following details while creating a user:
- Username
- Mobile Number
- Password
Specify whether the user is active or inactive. Inactive users cannot log in with their credentials.
You have to select customer while creating user you have multiple customer then you have to select which customer you want to asssigne for that user
Default Access
Each customer has one Super Admin user account by default given by anexgate, which cannot be deleted only you can reset password .The Super Admin has full access and permissions.
User Types:
You can create three types of users
Super Admin
- Full permissions, including: Adding, editing, and deleting devices.
- Creating and deleting other users for NMS server login.
Admin
- Has full permissions except for Creating users for NMS server login.
Viewer
Limited to viewing permissions:
- Cannot add, delete, or edit devices.
- Cannot redirect to the device dashboard.
- Can only observe and download reports.
This system ensures role-based access management for effective control and security.
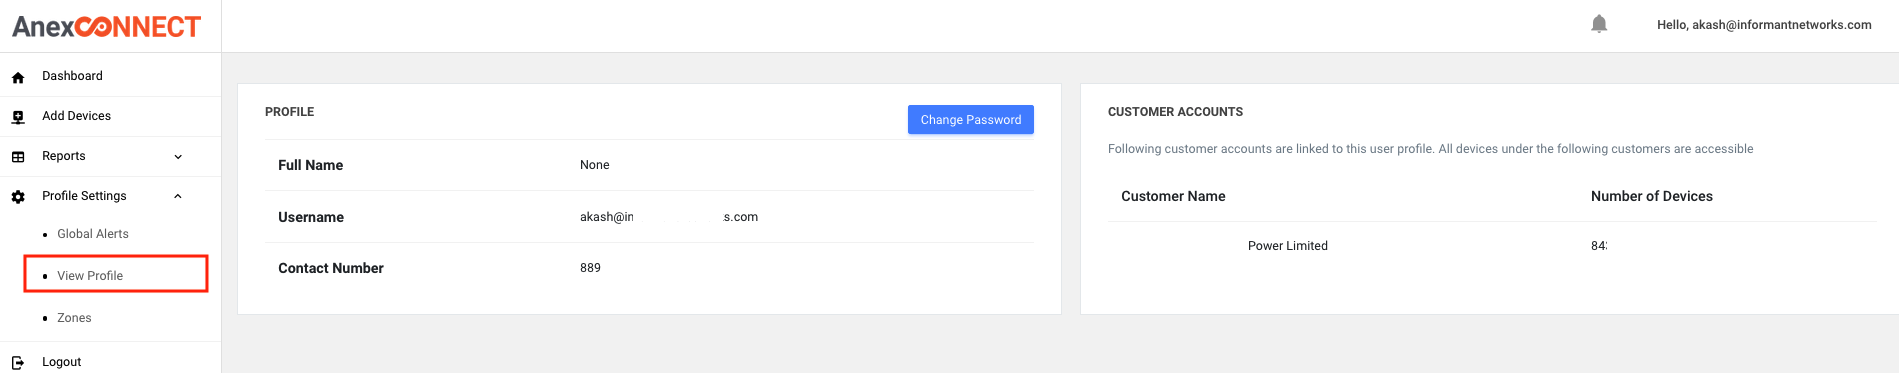
¶ View Profile
This feature helps in managing user accounts, monitoring their access, and making necessary changes, such as updating passwords.
The User Login Details feature provides the following information:
-
User Information:
Shows the user's email address and phone number. -
Password Management:
Allows you to change the user's password directly from this section. -
Customer Assignment:
Displays the customers assigned to the user. -
Device Access:
Shows how many devices the user has access to.
¶ Zone
This feature helps efficiently organize and manage devices within specific zones, allowing easy updates and reassignments as needed.
The Zone Feature simplifies reporting by allowing you to generate reports for all devices under a specific zone in just one step.
In the Zone Section, you can
-
Create Zones:
Create and delete any number of zones according to your requirements.
You can create multiple zones and empty zones for future use. -
Assign Devices to Zones:
While adding a device to the NMS server, you can select a specific zone for the device. The zone will automatically update with the added device. -
Manage Existing Devices:
If you already have a device or want to move a device between zones, you can remove and add devices from a specific zone directly in the Zone Tab. -
Update Zones via Device Settings:
When you enter a device, you’ll find an option called “Update”, which allows you to update the zone for that specific device.If you want to move a device between zones, you can remove and add devices from a specific zone
The update will reflect in the Zone Tab as well.
¶ Super Admin with their own NMS server
¶ Manage Customer
bellow option are availeable for the customer having there own NMS server on there VM platform
The Manage Customer option is:
Exclusive to Specific Customers:
- Available only for customers who have their own NMS server hosted on a VM platform.
Access Restriction:
- This tab is visle only to the main customer creation Super Admin login for that NMS server.
- Other users will not have access to this tab.
This ensures that only authorized Super Admins with specific permissions can manage customer-related settings on their dedicated NMS server.
To create a customer in the Manage Customer tab:
Steps to Create a Customer:
Enter Customer Details:
- Customer Name
- Number of Devices the customer can add.
- Username
- Mobile Number
- Password
- Set Customer Status:
Use the is Customer Active? option: - If selected, all users under this customer are active and can log in.
- If edited and disabled, all users under this customer become inactive, and they will not be able to login.
This feature simplifies managing customer accounts and their associated user access.
Steps to Delete a Customer:
Select the Customer:
- select the customer you want to delete from the list. chose delete selected customer option and press delete button
Result
The selected customer and all their respective users will be permanently deleted.
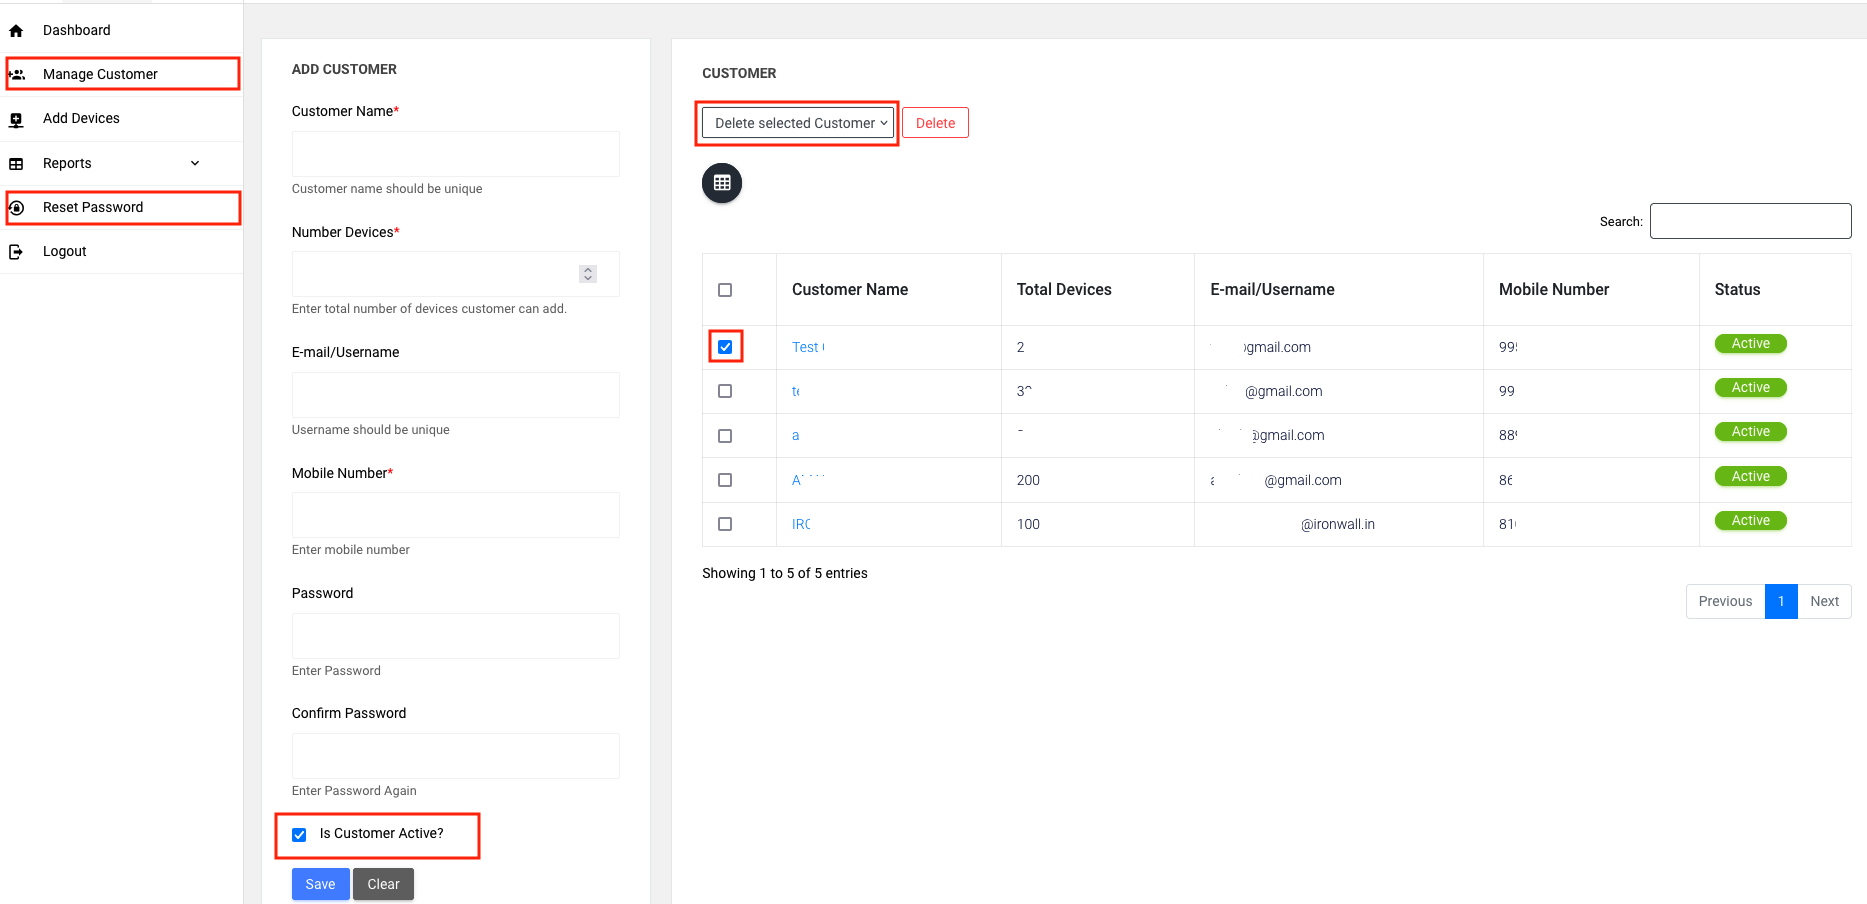
To change the password of a Customer Creation Super Admin login:
Select reset password, add new password, re-enter new password, and you will have reset the password through this method.
¶ Adding Device
When adding a device from the Customer Creation Super Admin, you need to follow these steps:
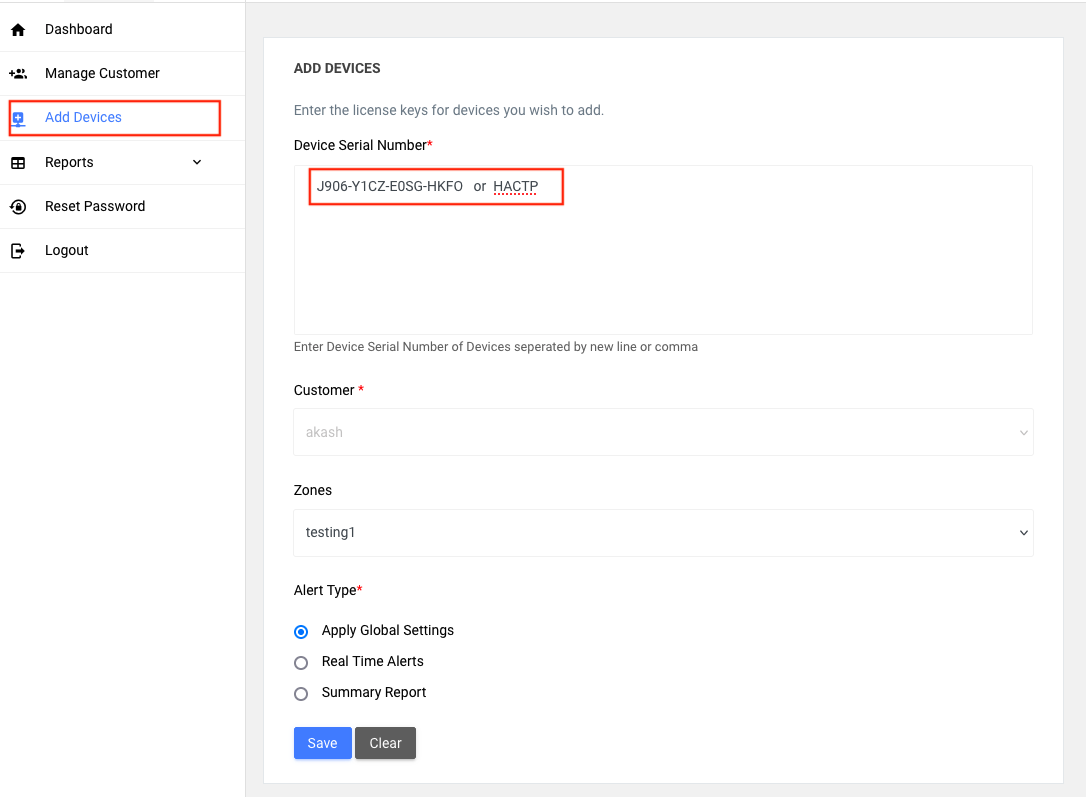
- Add License Key or Serial Number of the device (this field is mandatory).
- Customer Account to which the device will be added (this field is also mandatory).
- Select Zone (Optional): Choose the zone for the device. If you don’t select a zone, the device will be added to all zones of the respective customer by default.
These steps ensure that the device is added correctly to the desired customer account and zone.